Anthem Blue Cross 2000 Annual Report Download - page 26
Download and view the complete annual report
Please find page 26 of the 2000 Anthem Blue Cross annual report below. You can navigate through the pages in the report by either clicking on the pages listed below, or by using the keyword search tool below to find specific information within the annual report.-
 1
1 -
2
-
3
-
4
-
5
-
6
-
7
-
8
-
9
-
10
-
11
-
12
-
13
-
14
-
15
-
 16
16 -
 17
17 -
 18
18 -
 19
19 -
 20
20 -
 21
21 -
 22
22 -
 23
23 -
 24
24 -
 25
25 -
 26
26 -
 27
27 -
 28
28
 |
 |

24
Anthem Insurance Companies, Inc.
Notes to Consolidated Financial Statements (continued)
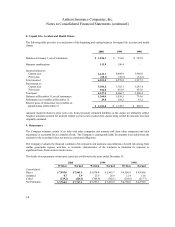
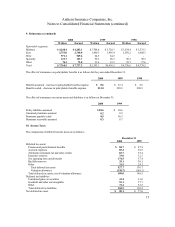
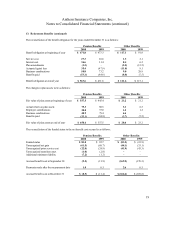
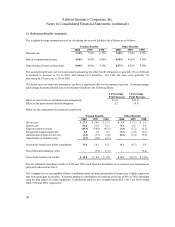
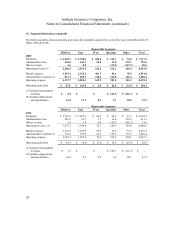
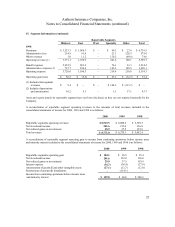
15. Segment Information (continued)
The following tables present operating gain (loss) by reportable segment for each of the years ended December 31,
2000, 1999 and 1998:
Reportable Segments
Midwest East West Specialty Other Total
2000
Premiums $ 4,203.1 $ 2,768.9 $ 569.6 $ 123.7 $ 72.0 $ 7,737.3
Administrative fees 254.8 144.1 52.8 31.8 272.1 755.6
Other revenues 2.6 8.9 –176.8 (137.7) 50.6
Operating revenue (1) 4,460.5 2,921.9 622.4 332.3 206.4 8,543.5
Benefit expense 3,555.4 2,332.4 491.7 92.6 78.9 6,551.0
Administrative expense (2) 817.3 485.7 128.2 214.8 162.4 1,808.4
Operating expense 4,372.7 2,818.1 619.9 307.4 241.3 8,359.4
Operating gain (loss) $ 87.8 $ 103.8 $ 2.5 $ 24.9 $ (34.9) $ 184.1
(1) Includes intersegment
revenues $ 8.2 $ – $ – $ 143.5 $ (151.7) $ –
(2) Includes depreciation
and amortization 16.9 17.1 8.7 2.1 30.5 75.3
Reportable Segments
Midwest East West Specialty Other Total
1999
Premiums $ 3,729.3 $ 1,495.4 $ 64.2 $ 96.3 $ 33.3 $ 5,418.5
Administrative fees 242.8 99.7 1.7 14.6 252.3 611.1
Other revenues 3.4 3.8 6.8 138.2 (101.2) 51.0
Operating revenue (1) 3,975.5 1,598.9 72.7 249.1 184.4 6,080.6
Benefit expense 3,162.2 1,259.9 55.0 73.8 31.8 4,582.7
Administrative expense (2) 776.9 339.9 21.2 159.1 172.3 1,469.4
Operating expense 3,939.1 1,599.8 76.2 232.9 204.1 6,052.1
Operating gain (loss) $ 36.4 $ (0.9) $ (3.5) $ 16.2 $ (19.7) $ 28.5
(1) Includes intersegment
revenues $ 7.5 $ –$ –$ 103.7 $ (111.2) $ –
(2) Includes depreciation
and amortization 16.6 8.5 0.5 1.4 20.1 47.1