Anthem Blue Cross 2000 Annual Report Download - page 12
Download and view the complete annual report
Please find page 12 of the 2000 Anthem Blue Cross annual report below. You can navigate through the pages in the report by either clicking on the pages listed below, or by using the keyword search tool below to find specific information within the annual report.-
 1
1 -
 2
2 -
 3
3 -
 4
4 -
 5
5 -
 6
6 -
 7
7 -
 8
8 -
 9
9 -
 10
10 -
 11
11 -
 12
12 -
 13
13 -
 14
14 -
 15
15 -
 16
16 -
 17
17 -
 18
18 -
 19
19 -
 20
20 -
 21
21 -
 22
22 -
23
-
24
-
25
-
26
-
27
-
28
 |
 |

10
Anthem Insurance Companies, Inc.
Notes to Consolidated Financial Statements (continued)
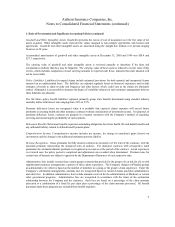
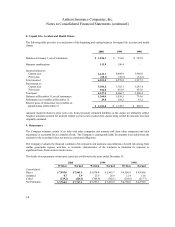
2. Acquisitions, Divestitures and Discontinued Operations (continued)
During 1998, the Company disposed of its health finance and management operations and its integrated health
delivery operations resulting in a net loss of $7.9 (including income tax expense of $2.7) greater than the reserve of
$43.2 (net of income tax benefit of $23.3) which was reported as discontinued operations in 1997.
Additionally, during 1998 the Company recognized a loss of $1.1, with no income tax benefit, relating to all other
operations discontinued in 1997.
Operating results from discontinued operations prior to disposal in 1998 (none in 2000 or 1999), exclusive of the
aforementioned provisions, were as follows: operating revenues $190.8, loss before provision for income taxes
$(5.6) and loss from discontinued operations net of income taxes $(3.9).
3. Endowment of Non-Profit Foundations
During 1999, Anthem reached agreements in the states of Kentucky, Ohio and Connecticut to resolve any questions
as to whether Anthem or the predecessor/successor entities were in possession of property that was impressed with a
charitable trust.
In 1999, contributions of $45.0, $28.0 and $41.1, respectively, were made for the benefit of charitable foundations
in Kentucky, Ohio, and Connecticut, respectively, from Anthem’ s subsidiaries, Anthem Health Plans of Kentucky,
Inc., Community Insurance Company and Anthem Health Plans, Inc., respectively.
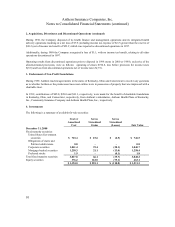
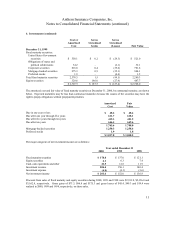
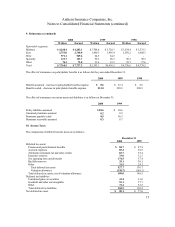
4. Investments
The following is a summary of available-for-sale securities:
Cost or
Amortized
Cost
Gross
Unrealized
Gains
Gross
Unrealized
(Losses) Fair Value
December 31, 2000
Fixed maturity securities:
United States Government
securities $ 723.4 $ 25.6 $ (2.5) $ 746.5
Obligations of states and
Political subdivisions 0.8 – – 0.8
Corporate securities 1,041.4 19.4 (20.1) 1,040.7
Mortgage-backed securities 1,250.3 21.1 (13.0) 1,258.4
Preferred stocks 1.9 –(0.1) 1.8
Total fixed maturity securities 3,017.8 66.1 (35.7) 3,048.2
Equity securities 376.2 162.0 (75.1) 463.1
$ 3,394.0 $ 228.1 $ (110.8) $ 3,511.3