Anthem Blue Cross 2000 Annual Report Download - page 15
Download and view the complete annual report
Please find page 15 of the 2000 Anthem Blue Cross annual report below. You can navigate through the pages in the report by either clicking on the pages listed below, or by using the keyword search tool below to find specific information within the annual report.-
 1
1 -
2
-
3
-
4
-
 5
5 -
 6
6 -
 7
7 -
 8
8 -
 9
9 -
 10
10 -
 11
11 -
 12
12 -
 13
13 -
 14
14 -
 15
15 -
 16
16 -
 17
17 -
 18
18 -
 19
19 -
 20
20 -
 21
21 -
 22
22 -
 23
23 -
 24
24 -
 25
25 -
26
-
27
-
28
 |
 |

13
Anthem Insurance Companies, Inc.
Notes to Consolidated Financial Statements (continued)
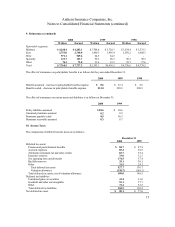
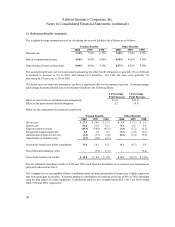
6. Fair Value of Financial Instruments
Considerable judgment is required to develop estimates of fair value for financial instruments. Accordingly, the
estimates shown are not necessarily indicative of the amounts that would be realized in a one time, current market
exchange of all of the financial instruments.
The carrying values and estimated fair values of certain financial instruments are as follows at December 31:
2000 1999
Carrying
Value
Fair
Value
Carrying
Value
Fair
Value
Fixed maturity securities $ 3,048.2 $ 3,048.2 $ 2,280.3 $ 2,280.3
Equity securities 463.1 463.1 487.7 487.7
Restricted investments 42.7 42.7 38.8 38.8
Debt 597.7 562.2 522.2 507.0
The carrying value of all other financial instruments approximates fair value because of the relatively short period of
time between the origination of the instruments and their expected realization. Fair values for securities and restricted
investments are based on quoted market prices, where available. For securities not actively traded, fair values are
estimated using values obtained from independent pricing services. The fair value of debt is estimated using discounted
cash flow analyses, based on the Company’ s current incremental borrowing rates for similar types of borrowing
arrangements.
7. Property and Equipment
Property and equipment includes the following at December 31:
2000 1999
Land and improvements $ 21.0 $ 17.2
Building and components 251.3 222.2
Data processing equipment, furniture
and other equipment 407.6 425.2
Leasehold improvements 37.2 39.2
717.1 703.8
Less accumulated depreciation and amortization 288.3 295.3
$ 428.8$ 408.5
Property and equipment includes non-cancelable capital leases of $7.4 and $8.7 at December 31, 2000 and 1999,
respectively. Total accumulated amortization on these leases at December 31, 2000 and 1999 was $3.7 and $4.5,
respectively. The related lease amortization expense is included in depreciation and amortization expense.
Depreciation and leasehold improvement amortization expense for 2000, 1999 and 1998 was $75.3, $47.1, and $43.7,
respectively.