Airtran 2007 Annual Report Download - page 33
Download and view the complete annual report
Please find page 33 of the 2007 Airtran annual report below. You can navigate through the pages in the report by either clicking on the pages listed below, or by using the keyword search tool below to find specific information within the annual report.-
 1
1 -
2
-
3
-
4
-
5
-
6
-
7
-
8
-
9
-
10
-
11
-
12
-
13
-
14
-
15
-
16
-
17
-
18
-
19
-
20
-
21
-
22
-
 23
23 -
 24
24 -
 25
25 -
 26
26 -
 27
27 -
 28
28 -
 29
29 -
 30
30 -
 31
31 -
 32
32 -
 33
33 -
 34
34 -
 35
35 -
 36
36 -
 37
37 -
 38
38 -
 39
39 -
 40
40 -
 41
41 -
 42
42 -
 43
43 -
44
-
45
-
46
-
47
-
48
-
49
-
50
-
51
-
52
-
53
-
54
-
55
-
56
-
57
-
58
-
59
-
60
-
61
-
62
-
63
-
64
-
65
-
66
-
67
-
68
-
69
-
70
-
71
-
72
-
73
-
74
-
75
-
76
-
77
-
78
-
79
-
80
-
81
-
82
-
83
-
84
-
85
-
86
-
87
-
88
-
89
-
90
-
91
-
92
 |
 |

27
RESULTS OF OPERATIONS
2007 Compared to 2006
Summary
We reported operating income of $137.9 million, net income of $52.7 million and diluted earnings per common share of $0.56 for the
year ended December 31, 2007. For 2006 we reported operating income of $40.9 million, net income of $14.7 million, and diluted
earnings per common share of $0.16.
Operating Revenues
Our operating revenues for year ended December 31, 2007 increased $417.9 million (22.1 percent), primarily due to a 21.2 percent
increase in passenger revenues. The increase in passenger revenues was largely due to a 25.0 percent increase in passenger traffic as
measured by revenue passenger miles (RPMs), net of the impact of a decrease in our average yield per RPM of 3.1 percent to 12.71
cents. The decrease in yield resulted primarily from an increase in the average stage length of 6.6 percent to 695 miles. Our average
fare increased 2.2 percent to $92.47. The 3.4 percentage point increase in load factor combined with the 3.1 percent decrease in yield
resulted in a 1.5 percent increase in passenger unit revenues as measured by passenger revenue per available seat mile (RASM) to 9.69
cents.
During the year ended December 31, 2007, we took delivery and placed in service ten B737 aircraft. As a result, our capacity, as
measured by available seat miles (ASMs), increased 19.4 percent. The combination of our 19.4 percent increase in capacity and 25.0
percent increase in traffic resulted in a 3.4 percentage point increase in passenger load factor to 76.2 percent.
Other revenues for 2007 increased $34.3 million (46.8 percent). Other revenues include change and cancellation fees, direct booking
fees, revenues derived from the sale of frequent flyer credits, excess baggage fees and other miscellaneous revenues. The increase in
other revenues is attributable primarily to increases in change and cancellation fees, direct booking fees and sales of frequent flyer
credits.
Operating Expenses
Our operating expenses for the year ended December 31, 2007 increased $320.8 million (17.3 percent) but decreased 1.7 percent on an
operating cost per ASM basis (CASM). Our financial results were significantly affected by changes in the price of fuel.
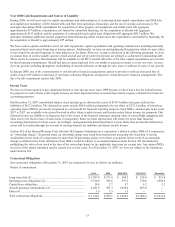
In general, our operating expenses are significantly affected by changes in our capacity, as measured by ASMs. The following table
presents our unit costs, defined as operating expense per ASM (CASM), for the indicated periods:
Yea
r
ended
December 31, Percent
Increase
(Decrease)
2007 2006
Aircraft fuel ................................................................................................................................... 3.54¢ 3.55¢ (0.3)%
Salaries, wages and benefits ........................................................................................................... 1.99 2.05 (2.9)
Aircraft rent................................................................................................................................... 1.07 1.21 (11.6)
Maintenance, materials and repairs................................................................................................. 0.67 0.66 1.5
Landing fees and other rents........................................................................................................... 0.54 0.53 1.9
Distribution.................................................................................................................................... 0.39 0.37 5.4
Marketing and advertising.............................................................................................................. 0.18 0.24 (25.0)
Aircraft insurance and security services.......................................................................................... 0.10 0.14 (28.6)
Depreciation .................................................................................................................................. 0.21 0.16 31.3
Other operating.............................................................................................................................. 0.88 0.83 6.0
Total CASM......................................................................................................................... 9.57¢ 9.74¢ (1.7)%
Aircraft fuel decreased 0.3 percent on a cost per ASM basis. Our fuel price per gallon, including taxes and into-plane fees, increased
2.8 percent from $2.17 during 2006 to $2.23 during 2007. However, average fuel cost per ASM was favorably impacted by increases
in both average stage length and average aircraft size, each of which tends to reduce fuel consumption per ASM.
Salaries, wages and benefits decreased 2.9 percent on a cost per ASM basis, primarily due to gains in productivity driven by an
increase in ASMs which exceeded the impact of the increase in salaries, wages, and benefits. We employed approximately 8,200 full-
time equivalent employees as of December 31, 2007, representing an 11.1 percent increase over the comparable date in 2006.