Airtran 2007 Annual Report Download - page 30
Download and view the complete annual report
Please find page 30 of the 2007 Airtran annual report below. You can navigate through the pages in the report by either clicking on the pages listed below, or by using the keyword search tool below to find specific information within the annual report.-
 1
1 -
2
-
3
-
4
-
5
-
6
-
7
-
8
-
9
-
10
-
11
-
12
-
13
-
14
-
15
-
16
-
17
-
18
-
19
-
 20
20 -
 21
21 -
 22
22 -
 23
23 -
 24
24 -
 25
25 -
 26
26 -
 27
27 -
 28
28 -
 29
29 -
 30
30 -
 31
31 -
 32
32 -
 33
33 -
 34
34 -
 35
35 -
 36
36 -
 37
37 -
 38
38 -
 39
39 -
 40
40 -
41
-
42
-
43
-
44
-
45
-
46
-
47
-
48
-
49
-
50
-
51
-
52
-
53
-
54
-
55
-
56
-
57
-
58
-
59
-
60
-
61
-
62
-
63
-
64
-
65
-
66
-
67
-
68
-
69
-
70
-
71
-
72
-
73
-
74
-
75
-
76
-
77
-
78
-
79
-
80
-
81
-
82
-
83
-
84
-
85
-
86
-
87
-
88
-
89
-
90
-
91
-
92
 |
 |

24
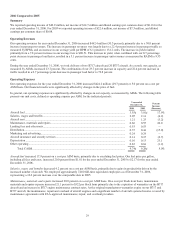
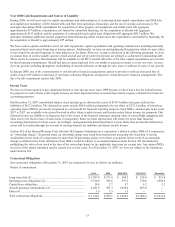
ITEM 6. SELECTED FINANCIAL AND OPERATING DATA
The following financial information for the five years ended December 31, 2007 has been derived from our Consolidated Financial
Statements. This information should be read in conjunction with the Consolidated Financial Statements and related notes thereto and
management’s discussion and analysis of financial condition and results of operations included elsewhere herein. No cash dividends
per common share were declared during the five years ended December 31, 2007.
Financial Data:
(in thousands, except per share data) 2007 2006 2005 2004 2003
Operating revenues ...............................
.
$ 2,309,983 $ 1,892,083 $ 1,449,700 $ 1,040,994 $ 917,404
Net income ...........................................
.
$ 52,683
(11) $ 14,714 $ 7,545 $ 9,834
(12) $ 100,935(13)
Earnings per common share:
Basic ...........................................
.
$ 0.58 $ 0.16 $ 0.09 $ 0.12 $ 1.34
Diluted ........................................
.
$ 0.56 $ 0.16 $ 0.08 $ 0.11 $ 1.22
Total assets at year-end .........................
.
$ 2,048,466 $ 1,603,582 $ 1,161,543 $ 904,792 $ 809,418
Long-term debt and capital lease
obligations including current
maturities at year-end .......................
.
$ 1,057,889 $ 811,110 $ 472,599 $ 313,970 $ 246,836
Operating Data:
Revenue passengers ..............................
.
23,780,058 20,051,219 16,638,214 13,170,230 11,651,340
Revenue passenger miles (RPM)
(000s)(1) ............................................
.
17,297,724 13,836,378 11,301,534 8,479,262 7,143,125
Available seat miles (ASM) (000s)
(2)
.....
.
22,692,355 19,007,416 15,369,505 11,977,443 10,046,385
Passenger load factor
(3)
..........................
.
76.2% 72.8% 73.5% 70.8% 71.1%
Break-even load factor
(4)
.......................
.
73.2% 71.8% 72.9% 69.7% 64.2%
Average fare, excluding transportation
taxes(5) ..............................................
.
$ 92.47 $ 90.51 $ 83.93 $ 76.30 $ 76.33
Average yield per RPM
(6)
......................
.
12.71 ¢ 13.12 ¢ 12.36 ¢ 11.85 ¢ 12.45 ¢
Passenger revenue per ASM (RASM)
(
7
)
.
.
9.69 ¢ 9.55 ¢ 9.09 ¢ 8.39 ¢ 8.85 ¢
Total revenue per ASM
(8)
......................
.
10.18 ¢ 9.95 ¢ 9.43 ¢ 8.69 ¢ 9.13 ¢
Operating cost per ASM (CASM)
(9)
.......
.
9.57 ¢ 9.74 ¢ 9.28 ¢ 8.45 ¢ 8.28 ¢
Average stage length (miles) .................
.
695 652 651 628 599
Average cost of aircraft fuel per gallon,
including fuel taxes and into-plane
fees ..................................................
.
$ 2.23 $ 2.17 $ 1.81 $ 1.22 $ 0.98
Average daily utilization (hours:
minutes) (10) ......................................
.
11:00 11:06 11:00 10:54 10:56
Number of operating aircraft in fleet at
end of year .......................................
.
137 127 105 87 74
Note: All monetary amounts listed below are pre-tax.
(1) The number of scheduled revenue miles flown by passengers
(2) The number of seats available for passengers multiplied by the number of miles the seats are flown
(3) The percentage of aircraft seating capacity that is actually utilized (RPMs divided by ASMs)
(4) The percentage of seats that must be occupied by revenue passengers in order for us to break even on a pre-tax income basis
(5) Passenger revenue divided by total passengers
(6) The average amount one passenger pays to fly one mile
(7) Passenger revenue divided by ASMs
(8) Total revenue divided by ASMs
(9) Operating expenses divided by ASMs
(10) The average amount of time per day that an aircraft flown is operated in revenue service
(11) Includes non-operating expenses of $10.7 million related to costs associated with the proposed acquisition of Midwest Air Group, Inc.
(Midwest), including exchange offer expenses consisting primarily of fees for attorneys, accountants, investment bankers, travel and other
related charges
(12) Includes a $1.3 million benefit related to our unsuccessful bid for certain leased gates and other assets of another airline at Chicago’s Midway
airport and $1.5 million of additional fuel expense related to prior periods
(13) Includes a $38.1 million payment received under the Wartime Act, deferred debt discount/issuance cost write-off of $12.3 million and reversal
of a tax valuation allowance of $15.9 million