Airtran 2001 Annual Report Download - page 9
Download and view the complete annual report
Please find page 9 of the 2001 Airtran annual report below. You can navigate through the pages in the report by either clicking on the pages listed below, or by using the keyword search tool below to find specific information within the annual report.-
 1
1 -
 2
2 -
 3
3 -
 4
4 -
 5
5 -
 6
6 -
 7
7 -
 8
8 -
 9
9 -
 10
10 -
 11
11 -
 12
12 -
 13
13 -
 14
14 -
 15
15 -
 16
16 -
 17
17 -
 18
18 -
 19
19 -
 20
20 -
21
-
22
-
23
-
24
-
25
-
26
-
27
-
28
-
29
-
30
-
31
-
32
-
33
-
34
-
35
-
36
-
37
-
38
-
39
-
40
-
41
-
42
-
43
-
44
 |
 |

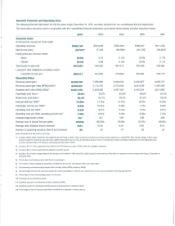
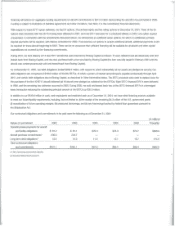
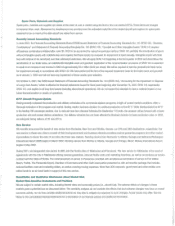
Selected
Financial
and
Operating
Data
The following financial information for the five years ended December 31, 2001 has been derived from
our
consolidated financial statements.
This information should
be
read in conjunction with the consolidated financial statements
and
related Notes thereto included elsewhere herein.
2001
2000
1999 1998
1997
j
Financial
Data:
(In
thousands, except per share data)
Operating
revenues
Net
income
(loss)
Earning loss
per
common
share:
Basic
Diluted
Total assets
at
year-end
Long-term
debt
obligations including current
maturities at year-end
Operating
Data:
Revenue
passengers
Revenue passenger miles
(RPM)
(OOOs)
~
Available seat mites
(ASM)
(oooS)'6)
Passenger
load
factor"
Break-even
load
factor'!'
Average yield
per
RPM
II
Passenger
revenue
per
ASM"OI
Operating
cost
per
ASM")
Operating
cost
per
ASM, excluding aircraft fuel
'2,
Average stage length (miles)
Average
cost
of
aircraft fuel
per
gallon
Average daily utilization (hours:minutes)13l
Number
of
operating aircraft in fleet at
end
of
period
$665,164
(2,7571"
(0.04)
(0.04)
497,816
268,211
8,302,732
4,506.007
6,537,756
68.9%
66.3%
14.3ge
9.92e
9.33e
7.20e
541
93.85e
9:54
59
6824.094 8523.468 8439.307 8211.456
47.436 (99.394)" (40.736)' (96,683)'
0.72 (1.53) (0.63)
(1.72)
0.69 (1.53) (063) (1.72)
546.255 467.014 376.406 433,864
427.903 415,688 245,994 250,712
7.566,986 6.460,533 5,462.827 3,005,731
4.115,745 3,473.490 3,244.539 1,597,585
5.859,395 5,467,556 5.442,234 3,017,892
70.2%
63.5%
59.6% 52.9%
64.7% 59.4% 61.5% 76.4%
14.70¢ 14,01¢ 12,97¢ 12.58¢
10.320 8.90¢ 7.730 6,66¢
9,270 8.19¢ 7.91¢ 9,37¢
6,870 6.94¢ 6.590 7,75¢
537 528 546 468
100.89¢ 49,95¢ 54,87¢ 69,00¢
10:18 9:54 9:42 8:25
53 47 50 53
Note:
AI
specl8lllems
~stecl
below
are
pnHax.
(1)
lnc:U:ies a
$28.0
millKln lfll)3IrmE!flt loss relateclto
0Uf
OC-g lIeeI,
en
$18.1
~
mpawmenllossIlease
temWlatlOfl charge related
to
0Uf
retKed
8737
lIeeI,
special
charges
01
$2.5
~
I'lC'l.IfT9d
dunng
lhe
Federal
ground
stop cnier, a529.0 milion grant Irom the
U.S.
govemrnenl pursuant
10
the
AI
Transportation salety and System SIabiizatIOfl
Act
(the
Stabization
Act).
and lhe
CUfTlIJatf'VEI
elfaet of a
change
10
accountlllQ pmcipIe of
SO.7
~
(2)
ndudes
a$147.7
miIion
Ifl"lI)airmenlIoss related
10
our OC-g fleet and a
g3IO
01
S19.6 million
tor
alil.gatlOn settlemenl
13J
ndudes
a$27.5
million
~11oss
related
to
0lK
8737
aircfaft
(4)
Inc:IuOeS
a$24.8
miIion
ct\afge related to the sta.rtdown
ollhe
ari"e
10
1996
af'd a
SS.2
miIion charge lor the renamng
01
the
aOle
..,
connectJon wrth the fTI(lfgEll'
WIth
fvways
Corpor'atJon
I"l
NoYember
1997
(5)
The rJJfllbef of sehedlAed revenue miles
lIown
by
passenge.-s
(6)
The rurnber of seats
available
lor passengers
rn.JltPied
by
!he l'UTlber of scheduled miles
each
seat
IS
lIown
(7)
The percentage of
81/'C1aft
seatng
capacity
that
IS
actually utlized tRPMs dMded
by
ASMs)
(8)
The percentage of seats that must
be
occupied
by
reverue
passengElI'S
11"I
cnier
lor us
10
break even on apre-tax lflCome basis, exdIdiog specl8l ilems
(9)
The
aV€l"age
amounl one passenger pays
to
fly
one
mile
(10) Passenger
revenue
dMded
by
ASMs
(11) Operallng expenses. exclucWlg special items.
dMded
by
ASMs
(\2)
Operating expenses.
exclucJiog
aircraft
fuel
expense and specl8lllems.
drvided
by
ASMs
(13)
The average number of hours per day that
en
aircraft
Rown
IS
operated in
revenue
service