Aflac 2010 Annual Report Download - page 6
Download and view the complete annual report
Please find page 6 of the 2010 Aflac annual report below. You can navigate through the pages in the report by either clicking on the pages listed below, or by using the keyword search tool below to find specific information within the annual report.-
 1
1 -
 2
2 -
 3
3 -
 4
4 -
 5
5 -
 6
6 -
 7
7 -
 8
8 -
 9
9 -
 10
10 -
 11
11 -
 12
12 -
 13
13 -
 14
14 -
 15
15 -
 16
16 -
 17
17 -
18
-
19
-
20
-
21
-
22
-
23
-
24
-
25
-
26
-
27
-
28
-
29
-
30
-
31
-
32
 |
 |

MESSAGE FROM MANAGEMENT
Daniel P. Amos
Chairman and CEO
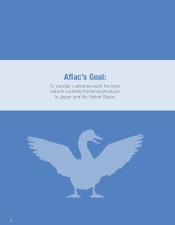
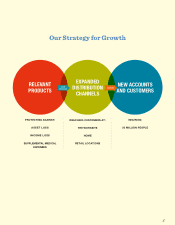
Aflac’s Growth Strategy:
A Foundation for Results
It is not an overstatement to say that
for more than three decades, our two-
part strategy for growth in Japan and
the United States has dramatically
transformed our business: Aflac offers
relevant products that provide financial
protection to consumers through
expanded distribution channels.
And 2010 was no different. Following
the turbulence of the financial markets
in 2009, 2010 provided a measure of
greater stability.
In good times or bad, we continue
to stick to what we do best: protecting
people when they need it most. Our
focus on this simple approach has helped
Aflac achieve solid financial results. Our
administrative efficiency and ability to
control expenses in both Japan and
the United States are reflected in low
operating expense ratios in both markets.
This allows us to create products that
provide excellent value to consumers
and pay competitive commissions.
Our strategy has also allowed us the
privilege of providing more than 50 million
people in the United States and Japan with
financial protection “under our wing,” while
enhancing shareholder value.
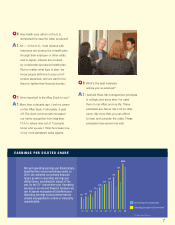
Disciplined Strategy Produces Results
Importantly, in 2010 we continued more
than two decades of achieving our operating
earnings per share objective, which is the
principal financial metric we use internally
to assess the growth of our business.
Operating earnings is defined as the growth
of net earnings per diluted share, excluding
items that are inherently uncontrollable or
unpredictable. We view this measure as
the best indicator of both the growth of
our business and management’s role in
generating that growth. Operating earnings
per diluted share rose 10.1% in 2010,
excluding the impact of the yen. We believe
that achieving our operating earnings
objective for more than two decades has
been a key driver of shareholder value.
Additionally, net earnings in 2010
increased 56.6% over 2009 to $2.3 billion.
Results for the full year benefited from
the stronger yen and from lower realized
investment losses in 2010, compared with
2009. Losses from securities transactions
and impairments impacted net earnings by
$273 million. In addition, net earnings were
suppressed by $1 million due to the impact
from ASC 810.
Capital Strength Means Capital
Deployment to Shareholders
In addition to delivering shareholder
value through our earnings growth, we
are very proud that 2010 marked the
28th consecutive year in which Aflac has
increased the
cash dividend.
The decision by
Aflac’s board
of directors to
increase the
cash dividend
is a function
of our strong
capital position. Maintaining this capital
strength is a priority for us and is primarily
measured using the statutory accounting
risk-based capital, or RBC, ratio. Our goal
was to end 2010 with a higher RBC ratio
than our year-end 2009 ratio of 479%,
and we surpassed our goal, ending 2010
at 555%. I believe our ability to maintain
a strong RBC ratio exemplifies our ability
to effectively manage our capital. Our
capital strength gave us the confidence
to resume our share repurchase program
in the fourth quarter of 2010, when we
purchased two million shares of Aflac
Incorporated stock. We anticipate
purchasing six to 12 million shares of
Aflac’s common stock in 2011.
Despite our intense focus on the
balance sheet, we never lost sight of
growing our business. Combined, we
generated more than $2.9 billion in new
annualized premium sales in the United
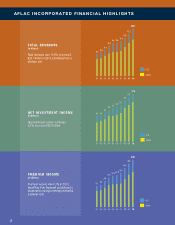
States and Japan in 2010. Total revenues
rose 13.6% to $20.7 billion, reflecting
solid growth in premium income and net
investment income, as well as the benefit
of the stronger yen/dollar exchange rate
for the year.
4
2010 marked the
28th consecutive
year in which
Aflac has
increased the
cash dividend.