Aflac 2010 Annual Report Download - page 21
Download and view the complete annual report
Please find page 21 of the 2010 Aflac annual report below. You can navigate through the pages in the report by either clicking on the pages listed below, or by using the keyword search tool below to find specific information within the annual report.-
 1
1 -
2
-
3
-
4
-
5
-
6
-
7
-
8
-
9
-
10
-
 11
11 -
 12
12 -
 13
13 -
 14
14 -
 15
15 -
 16
16 -
 17
17 -
 18
18 -
 19
19 -
 20
20 -
 21
21 -
 22
22 -
 23
23 -
 24
24 -
 25
25 -
 26
26 -
 27
27 -
 28
28 -
 29
29 -
 30
30 -
 31
31 -
32
 |
 |

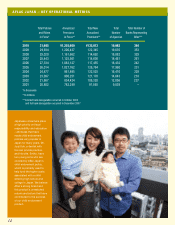
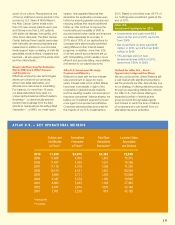
Policies and Annualized Total New Licensed Sales
Certificates Premiums Annualized Associates
in Force* in Force** Premiums** and Brokers
2010 11,436 $4,973 $1,382 72,535
2009 11,688 4,956 1,453 75,315
2008 11,437 4,789 1,551 74,390
2007 11,116 4,510 1,558 71,258
2006 10,519 4,101 1,423 68,394
2005 9,884 3,711 1,259 63,008
2004 9,341 3,374 1,186 58,992
2003 8,805 3,043 1,128 57,493
2002 8,077 2,674 1,070 53,149
2001 7,031 2,238 919 43,188
*In thousands
**In millions
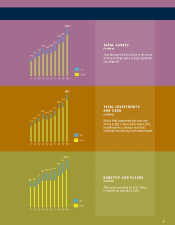
2010. Based on amortized cost, 95.7% of
our holdings were investment grade at the
end of 2010.
Aflac U.S.
Investment Highlights for 2010
• Investments and cash were $9.6
billion at the end of 2010, up 14.2%
from 2009
• Net investment income was $549
million in 2010, up 9.9% from $499
million in 2009
• The average yield on new
investments was 5.82% in 2010,
down from 7.26% in 2009
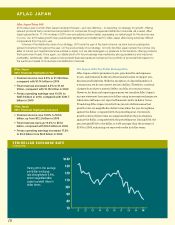
Outlook for Aflac U.S. – Great
Opportunity to Spread Our Wings
We are convinced the United States is still
a vast market with significant potential to
sell the products we offer. We will stay true
to our strategy of offering relevant products
through an expanding distribution network.
For Aflac U.S., that means offering an
expanded portfolio of individual and
group products through sales agents
and brokers to reach the tens of millions
of consumers who can benefit from our
affordable insurance protection.
a part of our culture. Recognized as one
of the top childhood cancer centers in the
country by U.S. News & World Report,
the Aflac Cancer Center treats more
than 370 new cancer patients each year
and follows more than 2,500 patients
with sickle cell disease, hemophilia, and
other blood disorders. The Aflac Cancer
Center features three hospital campuses
with nationally renowned physicians and
researchers in addition to a world-class
family support team consisting of child-life
specialists, social workers, chaplains and
teachers – all who support the whole child
and the child’s family.
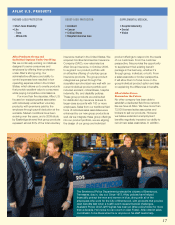
Employing Emerging Technologies
Means Efficiency, Effectiveness,
and Excellence
Effectively employing new technologies
allows us to improve our products,
attract new sales associates, and
allocate more resources to advertising.
For instance, for more than 16 years,
our sales associates have used our
unique laptop-based enrollment system,
SmartApp®, to electronically sell and
transmit new business from the field
directly to headquarters. SmartApp Next
Generation®, or SNG, our most recent
version, has upgraded features that
streamline the application process even
further by ensuring greater accuracy and
reducing policies that require additional
follow-up. We continue to improve the
functionality and versatility of SNG to
accommodate broker needs and empower
our sales associates for success. In
2010, about 93% of our applications for
coverage were electronically submitted
using SNG and other Internet-based
programs. In addition, more than 82%
of all new payroll accounts were set up
with Online Billing, which results in more
efficient and accurate billing, reconciliation,
and service to our payroll accounts.
Aflac U.S. Investment Strategy:
Prudent and Effective
While we’ve dealt with the low-interest-
rate environment in Japan for many
years, interest rates in the United States
have been more stable. In light of the
uncertainty in global financial markets,
and the resulting investor concerns about
insurance companies’ balance sheets, we
believe our investment approach proved
once again to be prudent and effective.
Corporate debt securities accounted for
the majority of our U.S. investments in
19
A f l A c u . s . – K e Y o P e r At i o n A l m e t r i c s