Aflac 2010 Annual Report Download - page 26
Download and view the complete annual report
Please find page 26 of the 2010 Aflac annual report below. You can navigate through the pages in the report by either clicking on the pages listed below, or by using the keyword search tool below to find specific information within the annual report.-
 1
1 -
2
-
3
-
4
-
5
-
6
-
7
-
8
-
9
-
10
-
11
-
12
-
13
-
14
-
15
-
 16
16 -
 17
17 -
 18
18 -
 19
19 -
 20
20 -
 21
21 -
 22
22 -
 23
23 -
 24
24 -
 25
25 -
 26
26 -
 27
27 -
 28
28 -
 29
29 -
 30
30 -
 31
31 -
 32
32
 |
 |

01 02 03 04 05 06 07 08 09 10
.193
.30
.38
.44
.55
.80
.96
1.12
$1.14
.23
Aflac has increased its annual
dividend for 28 consecutive
years. Total cash dividends paid
in 2010 rose 1.8% over 2009.
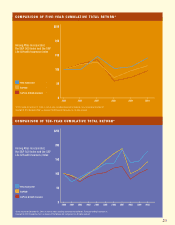
Aflac’s Total Return
to Shareholders
Aflac’s share price increased 22.0%
from the 2009 year-end price of
$46.25 to the 2010 year-end price
of $56.43. 2010 also marked the
28th consecutive year in which Aflac
Incorporated increased its annual
dividend. Including reinvested cash
dividends, Aflac’s total return to
shareholders was 24.9% in 2010.
This compares with a total return
of 25.3% for the S&P Life & Health
Index, 15.1% for the S&P 500 Index,
and 14.1% for the Dow Jones
Industrial Average.
• For the last five years, Aflac’s
total return to shareholders,
including reinvested dividends,
was 34.6%
• Over the last 10 years, our
total return to shareholders,
including reinvested dividends,
was 80.8%
AFL SHAREHOLDER MIX*
Number of registered shareholders . . . . . . . . . . . . . . . . . . . . 86,200
Percentage of outstanding AFL shares owned by institutional investors. . 67%
Percentage of outstanding AFL shares owned by individual investors. . . 33%
(includes director, employee and sales agent ownership of approximately 4%)
*Approximate, as of 12/31/10
FIRST SHAREHOLDERS
Cost of 100 shares purchased in 1955 when Aflac was founded . . . . $1,110
Number of shares those 100 shares grew into
(after 28 stock splits) . . . . . . . . . . . . . . . . . . . . . 187,980 shares
Value at 12/31/10 (excluding dividends) . . . . . . . . . . . . . . $10.6 million
Dividends paid in 2010 . . . . . . . . . . . . . . . . . . . . . . . . . . $214,297
AFLAC FINANCIAL STRENGTH*
Standard & Poor’s . . . . . . . . . . . . . . . . . . . . . . . . . . . . . . . AA-
Moody’s Investors Service. . . . . . . . . . . . . . . . . . . . . Aa2 (Excellent)
A.M. Best . . . . . . . . . . . . . . . . . . . . . . . . . . . . . . . A+ (Superior)
Rating and Investment Information Inc. (R&I) . . . . . . . . . . . . . . . . AA-
*Ratings as of 3/1/11
Visit aflac.com and click on Investors to access your AFL account, Aflac’s financial
information, calendar of events, and dividend reinvestment plan (DRIP) information
I N V E S T O R F A C T S
24
A n n u A l c A s h D i v i D e n D s PA i D P e r s h A r e