Aflac 2010 Annual Report Download - page 18
Download and view the complete annual report
Please find page 18 of the 2010 Aflac annual report below. You can navigate through the pages in the report by either clicking on the pages listed below, or by using the keyword search tool below to find specific information within the annual report.-
 1
1 -
2
-
3
-
4
-
5
-
6
-
7
-
 8
8 -
 9
9 -
 10
10 -
 11
11 -
 12
12 -
 13
13 -
 14
14 -
 15
15 -
 16
16 -
 17
17 -
 18
18 -
 19
19 -
 20
20 -
 21
21 -
 22
22 -
 23
23 -
 24
24 -
 25
25 -
 26
26 -
 27
27 -
 28
28 -
29
-
30
-
31
-
32
 |
 |

A F L A C U . S .
Aflac U.S.
2010 Financial Highlights
• Premium income increased 3.2% to $4.6
billion, up from $4.4 billion in 2009
• Total revenues were up 3.9% to $5.1
billion, increasing from $5.0 billion in 2009
• Pretax operating earnings rose 19.2% to
$924 million, compared with $776 million
in 2009
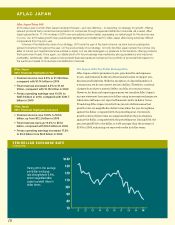
Supporting our field force is a priority for Aflac, and each year in December, Aflac’s field force
gathers at an event called FOCUS, where our field force leaders energize and strategize for the
upcoming year. Aflac Worldwide Headquarters employee Jennelle Primm, market development
analyst in the Business to Business department, shares the latest marketing tools and technologies
with field force leaders to empower them to succeed in 2011.
We entered 2010 amid an environment of record unemployment levels
and ongoing low confidence levels from consumers and small businesses.
With about 90% of our accounts being small businesses with fewer than
100 employees, our primary market is the slice of America that’s been hit
the hardest by the economic turmoil over the last two years. As such, we
were challenged in our U.S. sales growth and finished 2010 with a decline
in new annualized premium sales of 4.9%. This result included 2010 new
annualized premium sales from Aflac Group Insurance of $83 million, which
equated to about 6% of our total sales.
16