Aflac 2010 Annual Report Download - page 22
Download and view the complete annual report
Please find page 22 of the 2010 Aflac annual report below. You can navigate through the pages in the report by either clicking on the pages listed below, or by using the keyword search tool below to find specific information within the annual report.-
 1
1 -
2
-
3
-
4
-
5
-
6
-
7
-
8
-
9
-
10
-
11
-
 12
12 -
 13
13 -
 14
14 -
 15
15 -
 16
16 -
 17
17 -
 18
18 -
 19
19 -
 20
20 -
 21
21 -
 22
22 -
 23
23 -
 24
24 -
 25
25 -
 26
26 -
 27
27 -
 28
28 -
 29
29 -
 30
30 -
 31
31 -
 32
32
 |
 |

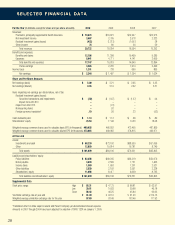
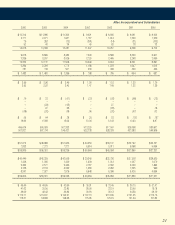
For the Year (In millions, except for share and per-share amounts) 2010 2009 2008 2007
Revenues:
Premiums, principally supplemental health insurance $ 18,073 $ 16,621 $ 14,947 $ 12,973
Net investment income 3,007 2,765 2,578 2,333
Realized investment gains (losses) (422) (1,212) (1,007) 28
Other income 74 80 36 59
Total revenues 20,732 18,254 16,554 15,393
Benefits and expenses:
Benefits and claims 12,106 11,308 10,499 9,285
Expenses 5,041 4,711 4,141 3,609
Total benefits and expenses 17,147 16,019 14,640 12,894
Pretax earnings 3,585 2,235 1,914 2,499
Income taxes 1,241 738 660 865
Net earnings $ 2,344 $ 1,497 $ 1,254 $ 1,634
Share and Per-Share Amounts
Net earnings (basic) $ 5.00 $ 3.21 $ 2.65 $ 3.35
Net earnings (diluted) 4.95 3.19 2.62 3.31
Items impacting net earnings per diluted share, net of tax:
Realized investment gains (losses):
Securities transactions and impairments $ (.58) $ (1.67) $ (1.37) $ .04
Impact from ASC 810 – – – –
Impact from ASC 815 – (.01) – –
Nonrecurring items – .02 – –
Foreign currency translation* .19 .26 .23 (.02)
Cash dividends paid $ 1.14 $ 1.12 $ .96 $ .80
Shareholders’ equity 23.54 17.96 14.23 18.08
Weighted-average common shares used to calculate basic EPS (In thousands) 469,038 466,552 473,405 487,869
Weighted-average common shares used to calculate diluted EPS (In thousands) 473,085 469,063 478,815 493,971
At Year-end
Assets:
Investments and cash $ 88,230 $ 73,192 $ 68,550 $ 57,056
Other 12,809 10,914 10,781 8,749
Total assets $ 101,039 $ 84,106 $ 79,331 $ 65,805
Liabilities and shareholders’ equity:
Policy liabilities $ 82,456 $ 69,245 $ 66,219 $ 50,676
Notes payable 3,038 2,599 1,721 1,465
Income taxes 1,969 1,653 1,201 2,531
Other liabilities 2,520 2,192 3,551 2,338
Shareholders’ equity 11,056 8,417 6,639 8,795
Total liabilities and shareholders’ equity $ 101,039 $ 84,106 $ 79,331 $ 65,805
Supplemental Data
Stock price range: High $ 58.31 $ 47.75 $ 68.81 $ 63.91
Low 39.91 10.83 29.68 45.18
Close 56.43 46.25 45.84 62.63
Yen/dollar exchange rate at year-end ¥ 81.49 ¥ 92.10 ¥ 91.03 ¥ 114.15
Weighted-average yen/dollar exchange rate for the year 87.69 93.49 103.46 117.93
*Translation effect on Aflac Japan’s results and Parent Company yen-denominated interest expense
Amounts in 2001 through 2004 have been adjusted for adoption of SFAS 123R on January 1, 2005
S E L E C T E D F I N A N C I A L D A T A
20