Aflac 2010 Annual Report Download - page 12
Download and view the complete annual report
Please find page 12 of the 2010 Aflac annual report below. You can navigate through the pages in the report by either clicking on the pages listed below, or by using the keyword search tool below to find specific information within the annual report.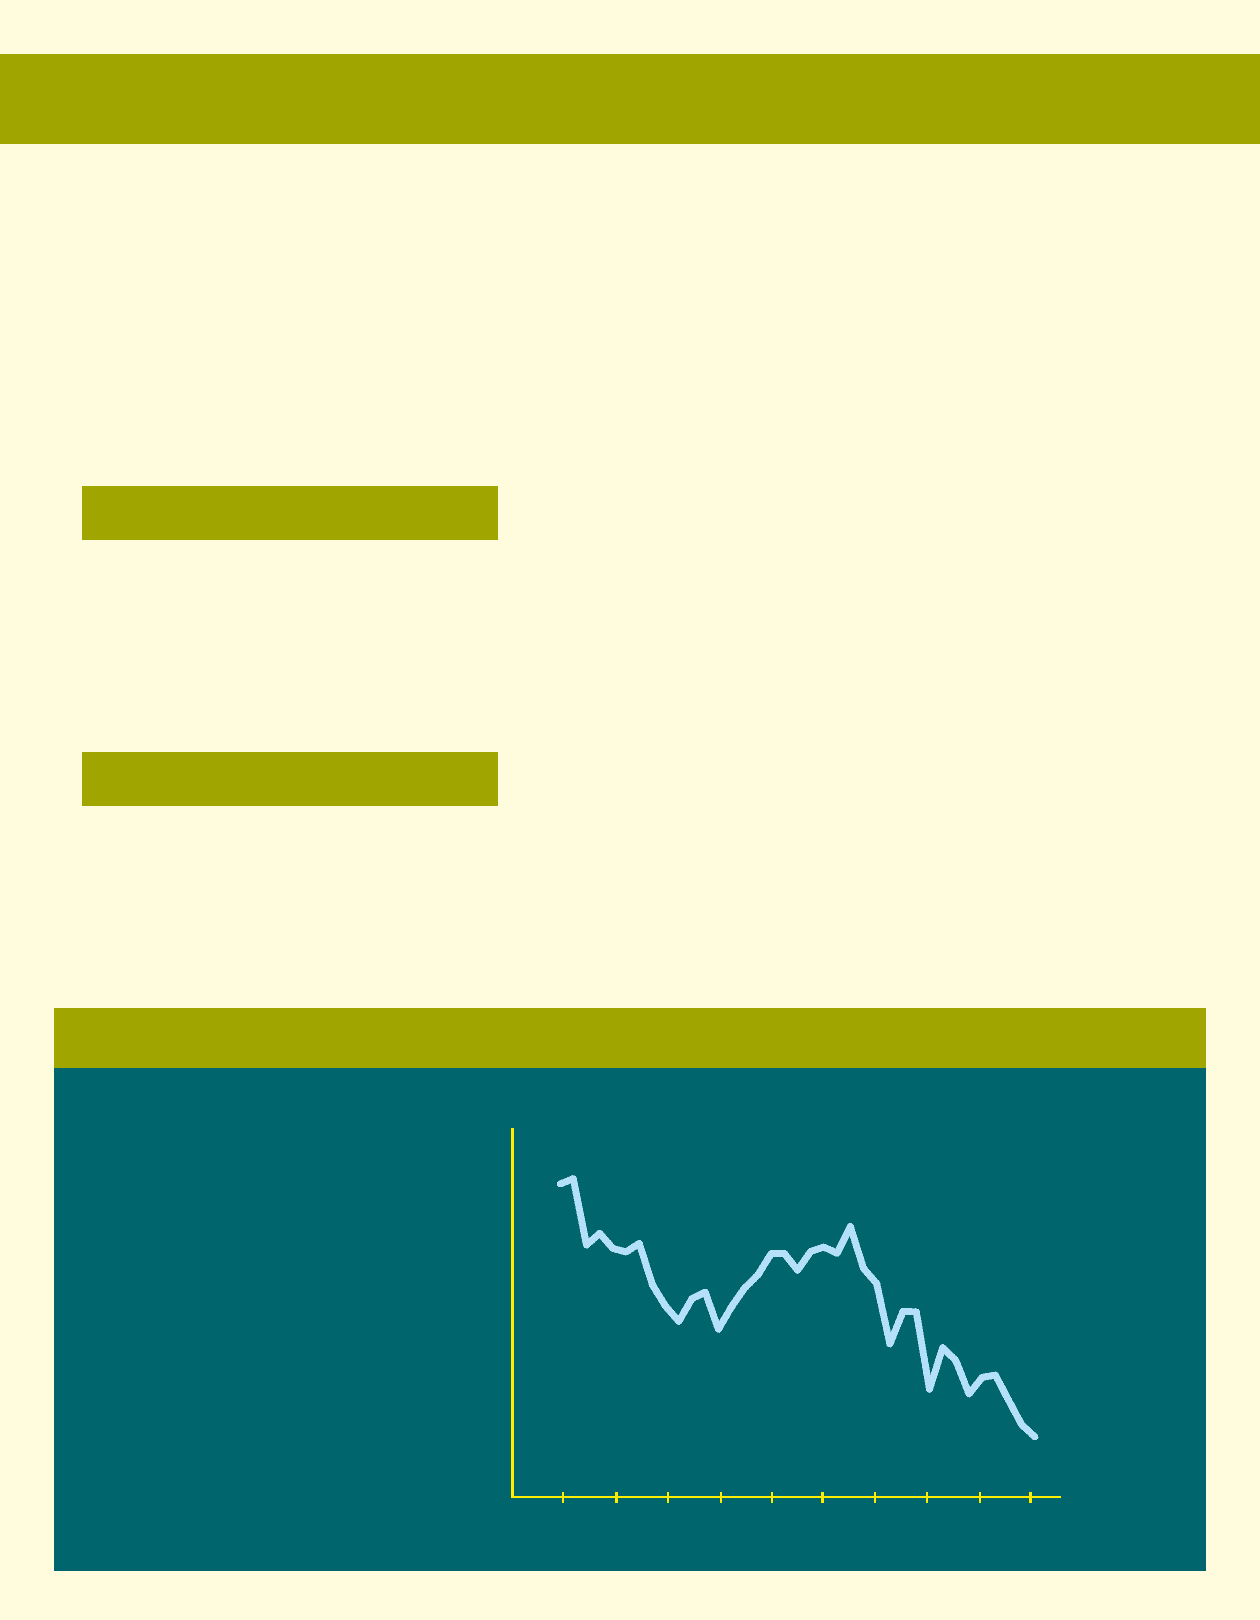
01 02 03 04 05 06 07 08 09 10
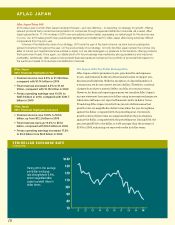
90
100
80
70
110
120
130
¥140
Y e n / D o l l A r e x c h A n g e r At e
(Closing rates)
During 2010, the average
yen/dollar exchange
rate strengthened 6.6%,
which magnified Aflac
Japan’s growth rates in
dollar terms
Aflac Japan Takes Off!
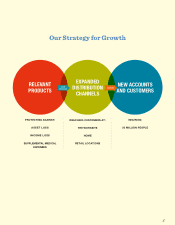
2010 was a year in which Aflac Japan remained focused – and very effective – in executing our strategy for growth: offering
relevant products that provide financial protection to consumers through expanded distribution channels. As a result, Aflac
Japan generated an 11.0% increase in 2010 new annualized premium sales, surpassing our sales target for the second year
in a row. Our 2010 sales growth was a particularly significant accomplishment for Aflac Japan after facing extremely difficult
comparisons from the prior year.
In terms of the distribution side of our strategy, 2010 was the year of the bank channel, as bank branch participation
gained momentum throughout the year. On the product side of our strategy, not only did Aflac Japan remain the number one
seller of cancer and medical insurance policies in Japan, but we also leveraged our presence in the banks by offering products
that banks want to sell. Once again, our stable block of in-force business was marked by strong persistency and improved
profitability. Additionally, Aflac Japan produced solid financial results and enhanced our portfolio of products that respond to
the wants and needs of consumers and distribution channels.
Aflac Japan
2010 Financial Highlights in Yen
• Premium income rose 3.8% to ¥1.18 trillion,
compared with ¥1.14 trillion in 2009
• Total revenues increased 3.4% to ¥1.40
trillion, compared with ¥1.35 trillion in 2009
• Pretax operating earnings rose 10.0% to
¥287.9 billion in 2010, compared with ¥261.7
billion in 2009
Aflac Japan
2010 Financial Highlights in Dollars
• Premium income rose 10.8% to $13.5
billion, up from $12.2 billion in 2009
• Total revenues were up 10.3% to $16.0
billion, compared with $14.5 billion in 2009
• Pretax operating earnings increased 17.3%
to $3.3 billion from $2.8 billion in 2009
The Impact of the Yen/Dollar Exchange Rate
Aflac Japan collects premiums in yen, pays benefits and expenses
in yen, and primarily holds yen-denominated assets to support yen-
denominated liabilities. With the exception of a limited number of
transactions, we do not convert yen into dollars. Therefore, currency
changes do not have a material effect on Aflac in economic terms.
However, for financial reporting purposes, we translate Aflac Japan’s
income statement from yen into dollars using an average exchange rate,
which does influence our reported financial results in dollar terms.
Translating Aflac Japan’s results from yen into dollars means that
growth rates are magnified in dollar terms when the yen strengthens
against the dollar, compared with the preceding year. Conversely,
growth rates in dollar terms are suppressed when the yen weakens
against the dollar, compared with the preceding year. During 2010, the
yen averaged 87.69 to the dollar, or 6.6% stronger than the average of
93.49 in 2009, enhancing our reported results in dollar terms.
10
A F L A C J A P A N


