Aflac 2010 Annual Report Download - page 10
Download and view the complete annual report
Please find page 10 of the 2010 Aflac annual report below. You can navigate through the pages in the report by either clicking on the pages listed below, or by using the keyword search tool below to find specific information within the annual report.-
 1
1 -
 2
2 -
 3
3 -
 4
4 -
 5
5 -
 6
6 -
 7
7 -
 8
8 -
 9
9 -
 10
10 -
 11
11 -
 12
12 -
 13
13 -
 14
14 -
 15
15 -
 16
16 -
 17
17 -
 18
18 -
 19
19 -
 20
20 -
 21
21 -
22
-
23
-
24
-
25
-
26
-
27
-
28
-
29
-
30
-
31
-
32
 |
 |

01 02 03 04 05 06 07 08 09 10
U.S.
Japan
16.6
9.6 10.3
11.4
13.3
14.4 14.6 15.4
18.3
$20.7
01 02 03 04 05 06 07 08 09 10
2.6
1.6 1.6
1.8
2.0 2.1 2.2 2.3
2.8
$3.0
U.S.
Japan
01 02 03 04 05 06 07 08 09 10
U.S.
Japan
14.9
8.18.6
9.9
11.3 12.012.3 13.0
16.6
$18.1
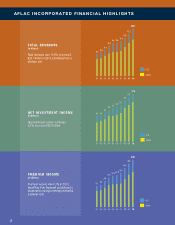
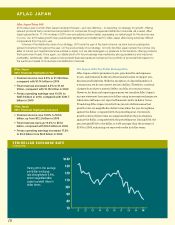
A F L A C I N C O R P O R A T E D F I N A N C I A L H I G H L I G H T S
t o tA l r e v e n u e s
(In billions)
Total revenues rose 13.6% to a record
$20.7 billion in 2010, benefiting from a
stronger yen
n e t i n v e s t m e n t i n c o m e
(In billions)
Net investment income increased
8.7% to a record $3.0 billion
P r e m i u m i n c o m e
(In billions)
Premium income rose 8.7% in 2010,
benefiting from improved persistency in
Japan and a stronger average yen/dollar
exchange rate
8