Vonage 2009 Annual Report Download - page 45
Download and view the complete annual report
Please find page 45 of the 2009 Vonage annual report below. You can navigate through the pages in the report by either clicking on the pages listed below, or by using the keyword search tool below to find specific information within the annual report.-
 1
1 -
2
-
3
-
4
-
5
-
6
-
7
-
8
-
9
-
10
-
11
-
12
-
13
-
14
-
15
-
16
-
17
-
18
-
19
-
20
-
21
-
22
-
23
-
24
-
25
-
26
-
27
-
28
-
29
-
30
-
31
-
32
-
33
-
34
-
 35
35 -
 36
36 -
 37
37 -
 38
38 -
 39
39 -
 40
40 -
 41
41 -
 42
42 -
 43
43 -
 44
44 -
 45
45 -
 46
46 -
 47
47 -
 48
48 -
 49
49 -
 50
50 -
 51
51 -
 52
52 -
 53
53 -
 54
54 -
 55
55 -
56
-
57
-
58
-
59
-
60
-
61
-
62
-
63
-
64
-
65
-
66
-
67
-
68
-
69
-
70
-
71
-
72
-
73
-
74
-
75
-
76
-
77
-
78
-
79
-
80
-
81
-
82
-
83
-
84
-
85
-
86
-
87
-
88
-
89
-
90
-
91
-
92
-
93
-
94
-
95
-
96
-
97
-
98
-
99
-
100
 |
 |

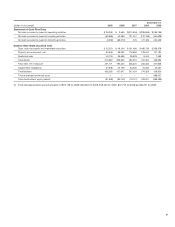
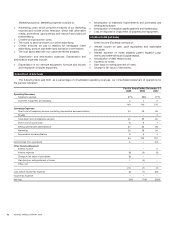
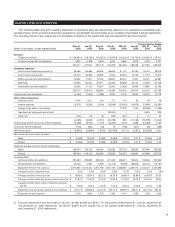
QUARTERLY RESULTS OF OPERATIONS
The following table sets forth quarterly statement of operations data. We derived this data from our unaudited consolidated finan-
cial statements, which we believe have been prepared on substantially the same basis as our audited consolidated financial statements.
The operating results in any quarter are not necessarily indicative of the results that may be expected for any future period.
For the Quarter Ended
(dollars in thousands, except operating data)
Mar 31,
2008
Jun 30,
2008
Sep 30,
2008
Dec 31,
2008
Mar 31,
2009
Jun 30,
2009
Sep 30,
2009
Dec 31,
2009
Revenue:
Telephony services $ 216,980 $ 218,738 $ 216,092 $ 213,955 $ 215,643 $ 214,709 $ 216,085 $ 218,411
Customer equipment and shipping 7,637 8,786 9,678 8,254 8,362 5,319 5,420 5,131
224,617 227,524 225,770 222,209 224,005 220,028 221,505 223,542
Operating expenses:
Direct cost of telephony services (1) 56,498 56,586 56,502 56,624 51,751 51,480 52,044 58,278
Direct cost of goods sold 22,072 18,533 20,835 17,942 20,512 16,179 17,727 17,070
Selling, general and administrative 79,392 77,931 73,035 68,627 68,051 71,327 63,187 62,891
Marketing 60,899 65,300 64,911 62,260 65,695 52,144 57,393 52,758
Depreciation and amortization 10,209 11,114 13,347 13,942 12,896 13,848 12,881 13,766
229,070 229,464 228,630 219,395 218,905 204,978 203,232 204,763
Income (loss) from operations (4,453) (1,940) (2,860) 2,814 5,100 15,050 18,273 18,779
Other income (expense):
Interest income 1,400 1,021 544 271 110 60 58 49
Interest expense (5,571) (5,535) (5,504) (13,268) (13,542) (13,679) (13,690) (13,281)
Change in fair value of derivatives ––––12,970 1,150 (62,998) (1,055)
Gain (loss) on extinguishment of debt – – – (30,570) – – 3,816 225
Other, net (164) 52 46 (181) 801 5 15 22
(4,335) (4,462) (4,914) (43,748) 339 (12,464) (72,799) (14,040)
Income (loss) before income tax benefit (expense) (8,788) (6,402) (7,774) (40,934) 5,439 2,586 (54,526) 4,739
Income tax benefit (expense) (173) (480) (43) 18 (168) (301) (29) (338)
Net income (loss) $ (8,961) $ (6,882) $ (7,817) $ (40,916) $ 5,271 $ 2,285 $ (54,555) $ 4,401
Net income (loss) per common share:
Basic $ (0.06) $ (0.04) $ (0.05) $ (0.26) $ 0.03 $ 0.01 $ (0.33) $ 0.02
Diluted $ (0.06) $ (0.04) $ (0.05) $ (0.26) $ (0.03) $ 0.01 $ (0.33) $ 0.02
Weighted-average common shares outstanding:
Basic 156,034 156,103 156,299 156,593 156,718 156,928 167,666 199,503
Diluted 156,034 156,103 156,299 156,593 218,787 218,997 167,666 203,376
Operating Data:
Gross subscriber line additions 281,329 230,832 238,430 201,423 226,610 143,645 190,834 187,592
Net subscriber line additions 30,133 2,080 9,460 (14,744) (6,493) (88,643) (50,191) (10,131)
Subscriber lines at end of period 2,610,360 2,612,440 2,621,900 2,607,156 2,583,861 2,495,218 2,445,027 2,434,896
Average monthly customer churn 3.3% 3.0% 3.0% 2.9% 3.1% 3.2% 3.4% 2.8%
Average monthly revenue per line $ 28.85 $ 29.04 $ 28.75 $ 28.33 $ 28.86 $ 28.88 $ 29.89 $ 30.54
Average monthly telephony services revenue per line $ 27.87 $ 27.92 $ 27.52 $ 27.28 $ 27.78 $ 28.18 $ 29.16 $ 29.84
Average monthly direct costs of telephony services
per line $ 7.26 $ 7.22 $ 7.20 $ 7.22 $ 6.67 $ 6.76 $ 7.02 $ 7.96
Marketing costs per gross subscriber line additions $ 216.47 $ 282.89 $ 272.24 $ 309.10 $ 289.90 $ 363.01 $ 300.75 $ 281.24
Employees at end of period 1,722 1,662 1,573 1,491 1,413 1,260 1,239 1,225
(1) Excludes depreciation and amortization of $4,701, $4,728, $4,908 and $5,917, for the quarters ended March 31, June 30, September 30
and December 31, 2008, respectively, and $4,757, $4,872, $4,371 and $5,178, for the quarters ended March 31, June 30, September 30
and December 31, 2009, respectively.
37