United Healthcare 2004 Annual Report Download - page 53
Download and view the complete annual report
Please find page 53 of the 2004 United Healthcare annual report below. You can navigate through the pages in the report by either clicking on the pages listed below, or by using the keyword search tool below to find specific information within the annual report.-
 1
1 -
2
-
3
-
4
-
5
-
6
-
7
-
8
-
9
-
10
-
11
-
12
-
13
-
14
-
15
-
16
-
17
-
18
-
19
-
20
-
21
-
22
-
23
-
24
-
25
-
26
-
27
-
28
-
29
-
30
-
31
-
32
-
33
-
34
-
35
-
36
-
37
-
38
-
39
-
40
-
41
-
42
-
 43
43 -
 44
44 -
 45
45 -
 46
46 -
 47
47 -
 48
48 -
 49
49 -
 50
50 -
 51
51 -
 52
52 -
 53
53 -
 54
54 -
 55
55 -
 56
56 -
 57
57 -
 58
58 -
 59
59 -
 60
60 -
 61
61 -
 62
62 -
 63
63 -
64
-
65
-
66
-
67
-
68
-
69
-
70
-
71
-
72
 |
 |

UNITEDHEALTH GROUP 51
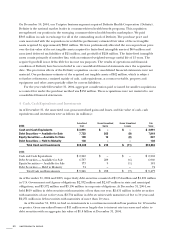
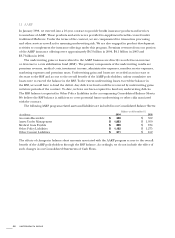
We recorded realized gains and losses on sales of investments, excluding the UnitedHealth Capital
disposition described below, as follows:
For the Year Ended December 31,
(in millions) 2004 2003 2002
Gross Realized Gains
$37
$45 $57
Gross Realized Losses
(18)
(23) (75)
Net Realized Gains (Losses)
$19
$22 $(18)
During the first quarter of 2004, we realized a capital gain of $25 million on the sale of certain
UnitedHealth Capital investments. With the gain proceeds from this sale, we made a cash contribution
of $25 million to the United Health Foundation in the first quarter of 2004. The realized gain of
$25 million and the related contribution expense of $25 million are included in Investment and
Other Income in the accompanying Consolidated Statements of Operations.
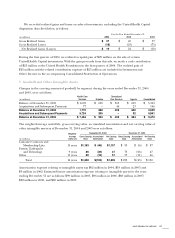
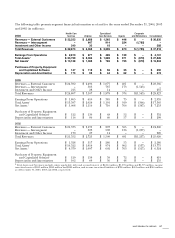
5 Goodwill and Other Intangible Assets
Changes in the carrying amount of goodwill, by segment, during the years ended December 31, 2004
and 2003, were as follows:
Health Care Specialized
(in millions)
Services Uniprise Care Services Ingenix Consolidated
Balance at December 31, 2002 $1,693 $698 $363 $609 $3,363
Acquisitions and Subsequent Payments 77 – 46 23 146
Balance at December 31, 2003 1,770 698 409 632 3,509
Acquisitions and Subsequent Payments 5,724 205 – 32 5,961
Balance at December 31, 2004 $ 7,494 $ 903 $ 409 $ 664 $ 9,470
The weighted-average useful life, gross carrying value, accumulated amortization and net carrying value of
other intangible assets as of December 31, 2004 and 2003 were as follows:
Weighted- December 31, 2004 December 31, 2003
Average Gross Carrying Accumulated Net Carrying Gross Carrying Accumulated Net Carrying
(in millions)
Useful Life Value Amortization Value Value Amortization Value
Customer Contracts and
Membership Lists 15 years
$1,153 $ (46) $1,107
$93 $(6) $87
Patents, Trademarks
and Technology 9 years
86 (39) 47
73 (26) 47
Other 11 years
69 (18) 51
57 (11) 46
Total 14 years
$1,308 $(103) $1,205
$223 $(43) $180
Amortization expense relating to intangible assets was $62 million in 2004, $18 million in 2003 and
$9million in 2002. Estimated future amortization expense relating to intangible assets for the years
ending December 31 are as follows: $99 million in 2005, $96 million in 2006, $88 million in 2007,
$82 million in 2008, and $80 million in 2009.