United Healthcare 2004 Annual Report Download - page 24
Download and view the complete annual report
Please find page 24 of the 2004 United Healthcare annual report below. You can navigate through the pages in the report by either clicking on the pages listed below, or by using the keyword search tool below to find specific information within the annual report.-
 1
1 -
2
-
3
-
4
-
5
-
6
-
7
-
8
-
9
-
10
-
11
-
12
-
13
-
 14
14 -
 15
15 -
 16
16 -
 17
17 -
 18
18 -
 19
19 -
 20
20 -
 21
21 -
 22
22 -
 23
23 -
 24
24 -
 25
25 -
 26
26 -
 27
27 -
 28
28 -
 29
29 -
 30
30 -
 31
31 -
 32
32 -
 33
33 -
 34
34 -
35
-
36
-
37
-
38
-
39
-
40
-
41
-
42
-
43
-
44
-
45
-
46
-
47
-
48
-
49
-
50
-
51
-
52
-
53
-
54
-
55
-
56
-
57
-
58
-
59
-
60
-
61
-
62
-
63
-
64
-
65
-
66
-
67
-
68
-
69
-
70
-
71
-
72
 |
 |

22 UNITEDHEALTH GROUP
2004 Results Compared to 2003 Results
CONSOLIDATED FINANCIAL RESULTS
Revenues
Revenues are comprised of premium revenues from risk-based products; service revenues, which primarily
include fees for management, administrative and consulting services; and investment and other income.
Premium revenues are primarily derived from risk-based health insurance arrangements in which
the premium is fixed, typically for a one-year period, and we assume the economic risk of funding our
customers’ health care services and related administrative costs. Service revenues consist primarily
of fees derived from services performed for customers that self-insure the medical costs of their employees
and their dependents. For both premium risk-based and fee-based customer arrangements, we provide
coordination and facilitation of medical services; transaction processing; customer, consumer and care
provider services; and access to contracted networks of physicians, hospitals and other health care professionals.
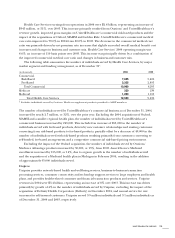
Consolidated revenues increased by $8.4 billion, or 29%, in 2004 to $37.2 billion, primarily as a
result of revenues from businesses acquired since the beginning of 2003. Excluding the impact of these
acquisitions, consolidated revenues increased by approximately 8% in 2004 as a result of rate increases
on premium-based and fee-based services and growth across business segments. Following is a discussion
of 2004 consolidated revenue trends for each of our three revenue components.
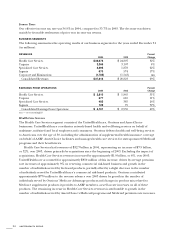
Premium Revenues Consolidated premium revenues in 2004 totaled $33.5 billion, an increase of
$8.0 billion, or 32%, over 2003. Excluding the impact of acquisitions, premium revenues increased by
approximately 8% in 2004. This increase was due in part to average net premium rate increases of
approximately 9% on UnitedHealthcare’s renewing commercial risk-based business, partially offset by a
slight decrease in the number of individuals served by UnitedHealthcare’s commercial risk-based products
and changes in the commercial product benefit and customer mix. In addition, Ovations’ premium
revenues increased largely due to increases in the number of individuals it serves through Medicare
Advantage products and changes in product mix related to Medicare supplement products, as well as rate
increases on all of these products. Premium revenues from AmeriChoice’s Medicaid programs and
Specialized Care Services’ businesses also increased due to advances in the number of individuals served
by those businesses.
Service Revenues Service revenues in 2004 totaled $3.3 billion, an increase of $217 million, or 7%, over
2003. The increase in service revenues was driven primarily by aggregate growth of 4% in the number
of individuals served by Uniprise and UnitedHealthcare under fee-based arrangements during 2004,
excluding the impact of acquisitions, as well as annual rate increases. In addition, Ingenix service revenues
increased due to new business growth in the health information and clinical research businesses.
Investment and Other Income Investment and other income totaled $388 million, representing an increase
of $131 million over 2003. Interest income increased by $134 million in 2004, principally due to the impact
of increased levels of cash and fixed-income investments during the year from the acquisitions of Oxford,
MAMSI and Golden Rule Financial Corporation (Golden Rule), which was acquired in November 2003.
Net capital gains on sales of investments were $19 million in 2004, a decrease of $3 million from 2003.