Unilever 2013 Annual Report Download - page 6
Download and view the complete annual report
Please find page 6 of the 2013 Unilever annual report below. You can navigate through the pages in the report by either clicking on the pages listed below, or by using the keyword search tool below to find specific information within the annual report.-
 1
1 -
 2
2 -
 3
3 -
 4
4 -
 5
5 -
 6
6 -
 7
7 -
 8
8 -
 9
9 -
 10
10 -
 11
11 -
 12
12 -
 13
13 -
 14
14 -
 15
15 -
 16
16 -
 17
17 -
18
-
19
-
20
-
21
-
22
-
23
-
24
-
25
-
26
-
27
-
28
-
29
-
30
-
31
-
32
-
33
-
34
-
35
-
36
-
37
-
38
-
39
-
40
-
41
-
42
-
43
-
44
-
45
-
46
-
47
-
48
-
49
-
50
-
51
-
52
-
53
-
54
-
55
-
56
-
57
-
58
-
59
-
60
-
61
-
62
-
63
-
64
-
65
-
66
-
67
-
68
-
69
-
70
-
71
-
72
-
73
-
74
-
75
-
76
-
77
-
78
-
79
-
80
-
81
-
82
-
83
-
84
-
85
-
86
-
87
-
88
-
89
-
90
-
91
-
92
-
93
-
94
-
95
-
96
-
97
-
98
-
99
-
100
-
101
-
102
-
103
-
104
-
105
-
106
-
107
-
108
-
109
-
110
-
111
-
112
-
113
-
114
-
115
-
116
-
117
-
118
-
119
-
120
-
121
-
122
-
123
-
124
-
125
-
126
-
127
-
128
-
129
-
130
-
131
-
132
-
133
-
134
-
135
-
136
-
137
-
138
-
139
-
140
-
141
-
142
-
143
-
144
-
145
-
146
-
147
-
148
-
149
-
150
-
151
-
152
-
153
 |
 |

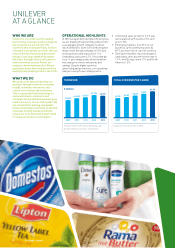
OUR KEY PERFORMANE INDIATORS
We report our performance against the four key financial and six
key non-financial performance indicators below. Our financial KPIs
are described in the Financial review starting on page 26 and our
non-financial KPIs are on pages 14, 16 and 20. Total recordable
accident frequency rate and the three manufacturing KPIs were
reported in 2012, while the two people-related KPIs covering
Basis of reporting: our accounting policies are
in accordance with International Financial
Reporting Standards (IFRS) as adopted by the
European Union (EU) and as issued by the
International Accounting Standards Board
(IASB), as well as United Kingdom and Dutch
law. Certain measures used in our reporting
are not defined under IFRS or other generally
accepted accounting principles. For further
information about these measures, and the
reasons why we believe they are important for
an understanding of the performance of the
business, please refer to our commentary on
non-GAAP measures on pages 32 and 33.
‡ Restated: see Financial review on page 26.
+ PricewaterhouseCoopers (PwC) assured.
In2013 we adjusted our reporting period
from 1 January – 31 December to 1 October
–30 September. We have recalculated the
prior 12 months to enable a like-for-like
comparison (this has not been assured
byPwC in 2013). For details and the basis
ofpreparation see: www.unilever.com/
ara2013/downloads.
2013
4.3%
2012: 6.9%
2013
2.5%
2012: 3.4%
2013
14.1%
2012: 13.7%‡
2013
€3.9 billion
2012: €4.3 billion
Underlying sales growth over five
years has averaged 5.1%. This
has been achieved despite highly
competitive markets.
Underlying volume growth
averaged 3.1% over five years.
The 2013 performance reflects
4.8% growth in emerging
markets (2012: 5.7%) and a 0.5%
decline in developed markets
(2012: 0.8% growth).
Core operating margin has
steadily increased over five years
from 12.5% to 14.1%. This reflects
increased focus on improving
gross margin and disciplined
costmanagement, and is after
increases in spend on advertising
and promotion.
Over the last five years Unilever
has generated free cash flow of
€18.7 billion. This has enabled
the Group to increase dividends,
repay debt and fund strategic
initiatives such as acquisitions.
diversity and employee engagement are being reported for the
first time. In2012, we also reported against four other key non-
financial indicators which are no longer reported as KPIs but are
incorporated into the reporting against our Unilever Sustainable
Living Plan (USLP) commitments on pages 22 and 23. They will
continue to be included in our online Unilever Sustainable Living
Report for 2013 to be published in April 2014.
FINANIAL
NONFINANIAL
2013
58%
male
2012: 60%
2013
78%
2012: 73%
2013
98.85KG+
2012: 104.23kg
2013
2.12m3+
2012: 2.27m3
2013
2.72kg+
2012: 3.94kg
2013
1.03+
2012: 1.17
The percentage of persons of each sex who were
Unilever managers.
CO2 from energy per tonne
of production.
Water per tonne of production. Total waste (sent for disposal)
per tonne of production.
Overall engagement score among
managers who participated in our
Global People Survey in 2013.
Per 1 million hours worked.
2013
42%
female
2012: 40%
3Strategc reportUnlever Annual Report and Accounts 2013
UNDERLYIN SALES
ROWTH UNDERLYIN VOLUME
ROWTH
ORE OPERATIN
MARIN FREE ASH FLOW
DIVERSITY
MANUFATURIN
ENAEMENT
TOTAL REORDABLE
AIDENT FREQUENY RATE