Unilever 2013 Annual Report Download - page 12
Download and view the complete annual report
Please find page 12 of the 2013 Unilever annual report below. You can navigate through the pages in the report by either clicking on the pages listed below, or by using the keyword search tool below to find specific information within the annual report.-
 1
1 -
 2
2 -
 3
3 -
 4
4 -
 5
5 -
 6
6 -
 7
7 -
 8
8 -
 9
9 -
 10
10 -
 11
11 -
 12
12 -
 13
13 -
 14
14 -
 15
15 -
 16
16 -
 17
17 -
 18
18 -
 19
19 -
 20
20 -
 21
21 -
 22
22 -
23
-
24
-
25
-
26
-
27
-
28
-
29
-
30
-
31
-
32
-
33
-
34
-
35
-
36
-
37
-
38
-
39
-
40
-
41
-
42
-
43
-
44
-
45
-
46
-
47
-
48
-
49
-
50
-
51
-
52
-
53
-
54
-
55
-
56
-
57
-
58
-
59
-
60
-
61
-
62
-
63
-
64
-
65
-
66
-
67
-
68
-
69
-
70
-
71
-
72
-
73
-
74
-
75
-
76
-
77
-
78
-
79
-
80
-
81
-
82
-
83
-
84
-
85
-
86
-
87
-
88
-
89
-
90
-
91
-
92
-
93
-
94
-
95
-
96
-
97
-
98
-
99
-
100
-
101
-
102
-
103
-
104
-
105
-
106
-
107
-
108
-
109
-
110
-
111
-
112
-
113
-
114
-
115
-
116
-
117
-
118
-
119
-
120
-
121
-
122
-
123
-
124
-
125
-
126
-
127
-
128
-
129
-
130
-
131
-
132
-
133
-
134
-
135
-
136
-
137
-
138
-
139
-
140
-
141
-
142
-
143
-
144
-
145
-
146
-
147
-
148
-
149
-
150
-
151
-
152
-
153
 |
 |

SUSTAINABLE
LIVING
PROFITABLE
VOLUME
GROWTH
COST
LEVERAGE +
EFFICIENCY
INNOVATION +
MARKETING
INVESTMENT
O
U
R
B
R
A
N
D
S
O
U
R
O
P
E
R
A
T
I
O
N
S
O
U
R
P
E
O
P
L
E
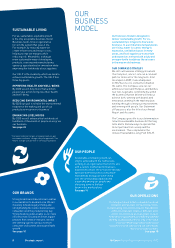
OUR BUSINESS MODEL
The inputs to our business model,
like those of all major packaged goods
manufacturers, are threefold: brands;
people; and operations. These map
directly on to our Compass ‘winning with’
commitments – with both continuous
improvement and the market place pillars
supporting the operations strand of
themodel.
The differentiator in our business model is
our USLP and the goal of sustainable living.
The outputs of the model are threefold:
sustained growth; lower environmental
impact; and positive social impact. These
align directly with our Vision statement.
The diagram represents our virtuous
circle of growth. It summarises, simply,
how we derive profit from our business
model.
PROFITABLE VOLUME
ROWTH
Profitable volume growth is the basis
of the virtuous circle of growth. The
drivers of our volume growth are
innovation and investment behind our
brands. Consistently strong volume
growth builds brand equity as we reach
more consumers, more often.
OST LEVERAE +
EFFIIENY
Profitable volume growth allows
us to optimise the utilisation of our
infrastructure and spread fixed costs
over a larger number of units produced,
reducing the average cost per unit. It
improves our profitability and allows
us to invest in the business.
INNOVATION +
MARKETIN INVESTMENT
Lower costs and improved efficiency enable
us to strengthen our business further.
New and improved products are the result
of investment in R&D and, together with
effective marketing, strengthen our brand
equity. This results in profitable volume
growth, self-perpetuating the virtuous
circle of growth.
9
Unlever Annual Report and Accounts 2013 Strategc report
A VIRTUOUS IRLE OF ROWTH