Under Armour 2010 Annual Report Download - page 67
Download and view the complete annual report
Please find page 67 of the 2010 Under Armour annual report below. You can navigate through the pages in the report by either clicking on the pages listed below, or by using the keyword search tool below to find specific information within the annual report.-
 1
1 -
2
-
3
-
4
-
5
-
6
-
7
-
8
-
9
-
10
-
11
-
12
-
13
-
14
-
15
-
16
-
17
-
18
-
19
-
20
-
21
-
22
-
23
-
24
-
25
-
26
-
27
-
28
-
29
-
30
-
31
-
32
-
33
-
34
-
35
-
36
-
37
-
38
-
39
-
40
-
41
-
42
-
43
-
44
-
45
-
46
-
47
-
48
-
49
-
50
-
51
-
52
-
53
-
54
-
55
-
56
-
 57
57 -
 58
58 -
 59
59 -
 60
60 -
 61
61 -
 62
62 -
 63
63 -
 64
64 -
 65
65 -
 66
66 -
 67
67 -
 68
68 -
 69
69 -
 70
70 -
 71
71 -
 72
72 -
 73
73 -
 74
74 -
 75
75 -
 76
76 -
 77
77 -
78
-
79
-
80
-
81
-
82
-
83
-
84
-
85
-
86
-
87
-
88
-
89
-
90
-
91
-
92
 |
 |

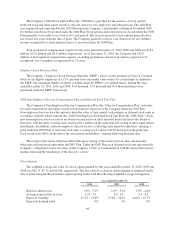
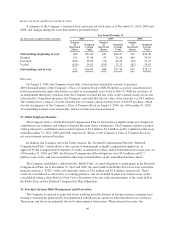
other than the Company’s CEO or a related party of the CEO, the shares automatically convert into shares of
Class A Common Stock on a one-for-one basis. In addition, all of the outstanding shares of Class B Convertible
Common Stock will automatically convert into shares of Class A Common Stock on a one-for-one basis on the
date upon which the shares of Class A Common Stock and Class B Convertible Common Stock beneficially
owned by the Company’s CEO is less than 15% of the total shares of Class A Common Stock and Class B
Convertible Common Stock outstanding. Holders of the Company’s common stock are entitled to receive
dividends when and if authorized and declared out of assets legally available for the payment of dividends.
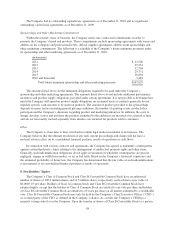
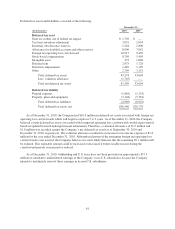
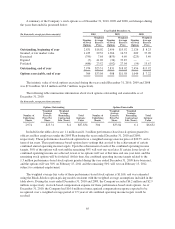
9. Fair Value Measurements
Fair value is defined as the price that would be received to sell an asset or paid to transfer a liability in an
orderly transaction between market participants at the measurement date (an exit price). The fair value
accounting guidance outlines a valuation framework, creates a fair value hierarchy in order to increase the
consistency and comparability of fair value measurements and the related disclosures and prioritizes the inputs
used in measuring fair value as follows:
Level 1: Observable inputs such as quoted prices in active markets;
Level 2: Inputs, other than quoted prices in active markets, that are observable either directly or
indirectly; and
Level 3: Unobservable inputs in which there is little or no market data, which require the reporting
entity to develop its own assumptions.
Financial assets and (liabilities) measured at fair value as of December 31, 2010 are set forth in the table
below:
(In thousands) Level 1 Level 2 Level 3
Derivative foreign currency forward contracts (see Note 14) $— $ (551) $—
TOLI held by the Rabbi Trust (see Note 13) — 3,593 —
Deferred Compensation Plan obligations (see Note 13) — (3,591) —
Fair values of the financial assets and liabilities listed above are determined using inputs that use as their
basis readily observable market data that are actively quoted and are validated through external sources,
including third-party pricing services and brokers. The foreign currency forward contracts represent gains and
losses on derivative contracts, which is the net difference between the U.S. dollars to be received or paid at the
contracts’ settlement date and the U.S. dollar value of the foreign currency to be sold or purchased at the current
forward exchange rate. The fair value of the TOLI held by the Rabbi Trust is based on the cash-surrender value
of the life insurance policies, which are invested primarily in mutual funds and a separately managed fixed
income fund. These investments are in the same funds and purchased in substantially the same amounts as the
selected investments of participants in the Deferred Compensation Plan, which represent the underlying liabilities
to participants in the Deferred Compensation Plan. Liabilities under the Deferred Compensation Plan are
recorded at amounts due to participants, based on the fair value of participants’ selected investments.
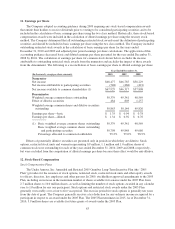
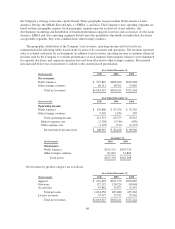
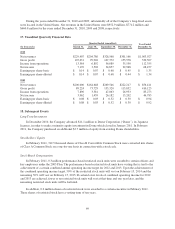
10. Provision for Income Taxes
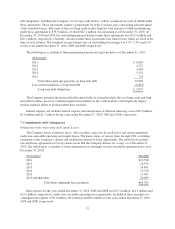
Income (loss) before income taxes is as follows:
Year Ended December 31,
(In thousands) 2010 2009 2008
Income (loss) before income taxes:
United States $ 96,179 $86,752 $ 85,204
Foreign 12,740 (4,334) (15,304)
Total $108,919 $82,418 $ 69,900
59