Under Armour 2010 Annual Report Download - page 56
Download and view the complete annual report
Please find page 56 of the 2010 Under Armour annual report below. You can navigate through the pages in the report by either clicking on the pages listed below, or by using the keyword search tool below to find specific information within the annual report.-
 1
1 -
2
-
3
-
4
-
5
-
6
-
7
-
8
-
9
-
10
-
11
-
12
-
13
-
14
-
15
-
16
-
17
-
18
-
19
-
20
-
21
-
22
-
23
-
24
-
25
-
26
-
27
-
28
-
29
-
30
-
31
-
32
-
33
-
34
-
35
-
36
-
37
-
38
-
39
-
40
-
41
-
42
-
43
-
44
-
45
-
 46
46 -
 47
47 -
 48
48 -
 49
49 -
 50
50 -
 51
51 -
 52
52 -
 53
53 -
 54
54 -
 55
55 -
 56
56 -
 57
57 -
 58
58 -
 59
59 -
 60
60 -
 61
61 -
 62
62 -
 63
63 -
 64
64 -
 65
65 -
 66
66 -
67
-
68
-
69
-
70
-
71
-
72
-
73
-
74
-
75
-
76
-
77
-
78
-
79
-
80
-
81
-
82
-
83
-
84
-
85
-
86
-
87
-
88
-
89
-
90
-
91
-
92
 |
 |

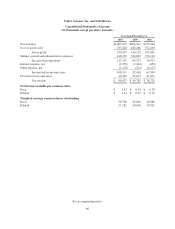
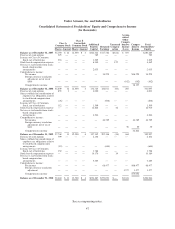
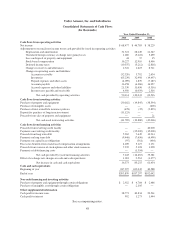
Under Armour, Inc. and Subsidiaries
Consolidated Statements of Cash Flows
(In thousands)
Year Ended December 31,
2010 2009 2008
Cash flows from operating activities
Net income $ 68,477 $ 46,785 $ 38,229
Adjustments to reconcile net income to net cash provided by (used in) operating activities
Depreciation and amortization 31,321 28,249 21,347
Unrealized foreign currency exchange rate (gains) losses 1,280 (5,222) 5,459
Loss on disposal of property and equipment 44 37 15
Stock-based compensation 16,227 12,910 8,466
Deferred income taxes (10,337) (5,212) (2,818)
Changes in reserves and allowances 2,322 1,623 8,711
Changes in operating assets and liabilities:
Accounts receivable (32,320) 3,792 2,634
Inventories (65,239) 32,998 (19,497)
Prepaid expenses and other assets (4,099) 1,870 (7,187)
Accounts payable 16,158 (4,386) 16,957
Accrued expenses and other liabilities 21,330 11,656 (5,316)
Income taxes payable and receivable 4,950 (6,059) 2,516
Net cash provided by operating activities 50,114 119,041 69,516
Cash flows from investing activities
Purchase of property and equipment (30,182) (19,845) (38,594)
Purchase of intangible assets — — (600)
Purchase of trust owned life insurance policies (478) (35) (2,893)
Deposit for purchase of long term investment (11,125) — —
Proceeds from sales of property and equipment — — 21
Net cash used in investing activities (41,785) (19,880) (42,066)
Cash flows from financing activities
Proceeds from revolving credit facility — — 40,000
Payments on revolving credit facility — (25,000) (15,000)
Proceeds from long term debt 5,262 7,649 13,214
Payments on long term debt (9,446) (7,656) (6,490)
Payments on capital lease obligations (97) (361) (464)
Excess tax benefits from stock-based compensation arrangements 4,189 5,127 2,131
Proceeds from exercise of stock options and other stock issuances 7,335 5,128 1,990
Payments of debt financing costs — (1,354) —
Net cash provided by (used in) financing activities 7,243 (16,467) 35,381
Effect of exchange rate changes on cash and cash equivalents 1,001 2,561 (1,377)
Net increase in cash and cash equivalents 16,573 85,255 61,454
Cash and cash equivalents
Beginning of year 187,297 102,042 40,588
End of year $203,870 $187,297 $102,042
Non-cash financing and investing activities
Purchase of property and equipment through certain obligations $ 2,922 $ 4,784 $ 2,486
Purchase of intangible asset through certain obligations — 2,105 —
Other supplemental information
Cash paid for income taxes 38,773 40,834 29,561
Cash paid for interest 992 1,273 1,444
See accompanying notes.
48