Under Armour 2010 Annual Report Download - page 53
Download and view the complete annual report
Please find page 53 of the 2010 Under Armour annual report below. You can navigate through the pages in the report by either clicking on the pages listed below, or by using the keyword search tool below to find specific information within the annual report.-
 1
1 -
2
-
3
-
4
-
5
-
6
-
7
-
8
-
9
-
10
-
11
-
12
-
13
-
14
-
15
-
16
-
17
-
18
-
19
-
20
-
21
-
22
-
23
-
24
-
25
-
26
-
27
-
28
-
29
-
30
-
31
-
32
-
33
-
34
-
35
-
36
-
37
-
38
-
39
-
40
-
41
-
42
-
 43
43 -
 44
44 -
 45
45 -
 46
46 -
 47
47 -
 48
48 -
 49
49 -
 50
50 -
 51
51 -
 52
52 -
 53
53 -
 54
54 -
 55
55 -
 56
56 -
 57
57 -
 58
58 -
 59
59 -
 60
60 -
 61
61 -
 62
62 -
 63
63 -
64
-
65
-
66
-
67
-
68
-
69
-
70
-
71
-
72
-
73
-
74
-
75
-
76
-
77
-
78
-
79
-
80
-
81
-
82
-
83
-
84
-
85
-
86
-
87
-
88
-
89
-
90
-
91
-
92
 |
 |

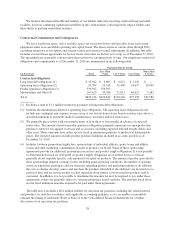
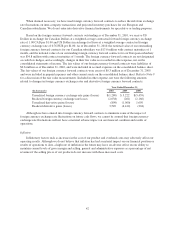
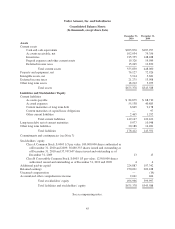
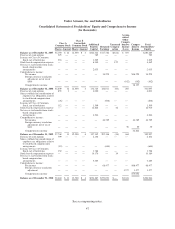
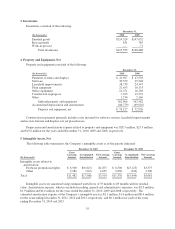
Under Armour, Inc. and Subsidiaries
Consolidated Balance Sheets
(In thousands, except share data)
December 31,
2010
December 31,
2009
Assets
Current assets
Cash and cash equivalents $203,870 $187,297
Accounts receivable, net 102,034 79,356
Inventories 215,355 148,488
Prepaid expenses and other current assets 19,326 19,989
Deferred income taxes 15,265 12,870
Total current assets 555,850 448,000
Property and equipment, net 76,127 72,926
Intangible assets, net 3,914 5,681
Deferred income taxes 21,275 13,908
Other long term assets 18,212 5,073
Total assets $675,378 $545,588
Liabilities and Stockholders’ Equity
Current liabilities
Accounts payable $ 84,679 $ 68,710
Accrued expenses 55,138 40,885
Current maturities of long term debt 6,865 9,178
Current maturities of capital lease obligations — 97
Other current liabilities 2,465 1,292
Total current liabilities 149,147 120,162
Long term debt, net of current maturities 9,077 10,948
Other long term liabilities 20,188 14,481
Total liabilities 178,412 145,591
Commitments and contingencies (see Note 7)
Stockholders’ equity
Class A Common Stock, $.0003 1/3 par value; 100,000,000 shares authorized as
of December 31, 2010 and 2009; 38,660,355 shares issued and outstanding as
of December 31, 2010 and 37,747,647 shares issued and outstanding as of
December 31, 2009 13 13
Class B Convertible Common Stock, $.0003 1/3 par value; 12,500,000 shares
authorized, issued and outstanding as of December 31, 2010 and 2009 4 4
Additional paid-in capital 224,887 197,342
Retained earnings 270,021 202,188
Unearned compensation — (14)
Accumulated other comprehensive income 2,041 464
Total stockholders’ equity 496,966 399,997
Total liabilities and stockholders’ equity $675,378 $545,588
See accompanying notes.
45