Under Armour 2010 Annual Report Download - page 43
Download and view the complete annual report
Please find page 43 of the 2010 Under Armour annual report below. You can navigate through the pages in the report by either clicking on the pages listed below, or by using the keyword search tool below to find specific information within the annual report.-
 1
1 -
2
-
3
-
4
-
5
-
6
-
7
-
8
-
9
-
10
-
11
-
12
-
13
-
14
-
15
-
16
-
17
-
18
-
19
-
20
-
21
-
22
-
23
-
24
-
25
-
26
-
27
-
28
-
29
-
30
-
31
-
32
-
 33
33 -
 34
34 -
 35
35 -
 36
36 -
 37
37 -
 38
38 -
 39
39 -
 40
40 -
 41
41 -
 42
42 -
 43
43 -
 44
44 -
 45
45 -
 46
46 -
 47
47 -
 48
48 -
 49
49 -
 50
50 -
 51
51 -
 52
52 -
 53
53 -
54
-
55
-
56
-
57
-
58
-
59
-
60
-
61
-
62
-
63
-
64
-
65
-
66
-
67
-
68
-
69
-
70
-
71
-
72
-
73
-
74
-
75
-
76
-
77
-
78
-
79
-
80
-
81
-
82
-
83
-
84
-
85
-
86
-
87
-
88
-
89
-
90
-
91
-
92
 |
 |

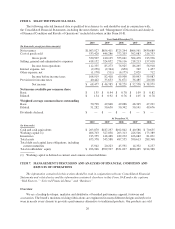
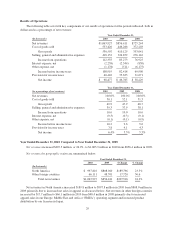
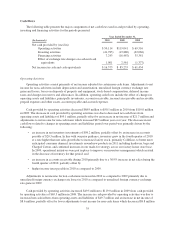
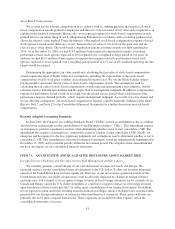
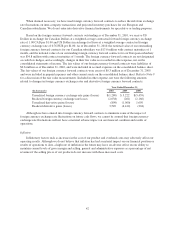
Cash Flows
The following table presents the major components of net cash flows used in and provided by operating,
investing and financing activities for the periods presented:
Year Ended December 31,
(In thousands) 2010 2009 2008
Net cash provided by (used in):
Operating activities $ 50,114 $119,041 $ 69,516
Investing activities (41,785) (19,880) (42,066)
Financing activities 7,243 (16,467) 35,381
Effect of exchange rate changes on cash and cash
equivalents 1,001 2,561 (1,377)
Net increase in cash and cash equivalents $ 16,573 $ 85,255 $ 61,454
Operating Activities
Operating activities consist primarily of net income adjusted for certain non-cash items. Adjustments to net
income for non-cash items include depreciation and amortization, unrealized foreign currency exchange rate
gains and losses, losses on disposals of property and equipment, stock-based compensation, deferred income
taxes and changes in reserves and allowances. In addition, operating cash flows include the effect of changes in
operating assets and liabilities, principally inventories, accounts receivable, income taxes payable and receivable,
prepaid expenses and other assets, accounts payable and accrued expenses.
Cash provided by operating activities decreased $68.9 million to $50.1 million in 2010 from $119.0 million
in 2009. The decrease in cash provided by operating activities was due to decreased net cash flows from
operating assets and liabilities of $99.1 million, partially offset by an increase in net income of $21.7 million and
adjustments to net income for non-cash items which increased $8.5 million year over year. The decrease in net
cash flows related to changes in operating assets and liabilities period over period was primarily driven by the
following:
• an increase in net inventory investments of $98.2 million, partially offset by an increase in accounts
payable of $20.5 million. In line with our prior guidance, inventory grew in the fourth quarter of 2010
at a rate higher than net sales growth due to increased safety stock, primarily ColdGear, to better meet
anticipated consumer demand, investments around new products in 2011 including headwear, bags and
Charged Cotton, and continued increases in our made-for strategy across our factory house store base.
In 2009, operational initiatives were put in place to improve our inventory management which assisted
in the decrease of inventory for that period; and
• an increase in accounts receivable during 2010 primarily due to a 36.9% increase in net sales during the
fourth quarter of 2010; partially offset by
• higher income taxes payable in 2010 as compared to 2009.
Adjustments to net income for non-cash items increased in 2010 as compared to 2009 primarily due to
unrealized foreign currency exchange rate losses in 2010 as compared to unrealized foreign currency exchange
rate gains in 2009.
Cash provided by operating activities increased $49.5 million to $119.0 million in 2009 from cash provided
by operating activities of $69.5 million in 2008. The increase in cash provided by operating activities was due to
increased net cash inflows from operating assets and liabilities of $49.7 million and an increase in net income of
$8.6 million, partially offset by lower adjustments to net income for non-cash items which decreased $8.8 million
35