Under Armour 2010 Annual Report Download - page 42
Download and view the complete annual report
Please find page 42 of the 2010 Under Armour annual report below. You can navigate through the pages in the report by either clicking on the pages listed below, or by using the keyword search tool below to find specific information within the annual report.-
 1
1 -
2
-
3
-
4
-
5
-
6
-
7
-
8
-
9
-
10
-
11
-
12
-
13
-
14
-
15
-
16
-
17
-
18
-
19
-
20
-
21
-
22
-
23
-
24
-
25
-
26
-
27
-
28
-
29
-
30
-
31
-
 32
32 -
 33
33 -
 34
34 -
 35
35 -
 36
36 -
 37
37 -
 38
38 -
 39
39 -
 40
40 -
 41
41 -
 42
42 -
 43
43 -
 44
44 -
 45
45 -
 46
46 -
 47
47 -
 48
48 -
 49
49 -
 50
50 -
 51
51 -
 52
52 -
53
-
54
-
55
-
56
-
57
-
58
-
59
-
60
-
61
-
62
-
63
-
64
-
65
-
66
-
67
-
68
-
69
-
70
-
71
-
72
-
73
-
74
-
75
-
76
-
77
-
78
-
79
-
80
-
81
-
82
-
83
-
84
-
85
-
86
-
87
-
88
-
89
-
90
-
91
-
92
 |
 |

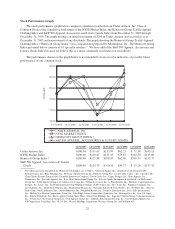
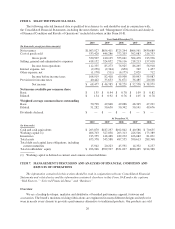
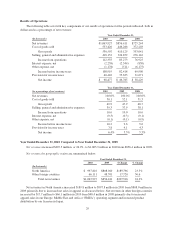
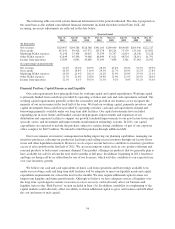
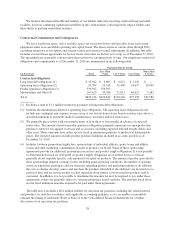
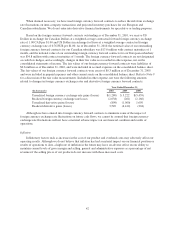
The following table sets forth certain financial information for the periods indicated. The data is prepared on
the same basis as the audited consolidated financial statements included elsewhere in this Form 10-K. All
recurring, necessary adjustments are reflected in the data below.
Quarter Ended
Mar 31,
2010
Jun 30,
2010
Sep 30,
2010
Dec 31,
2010
Mar 31,
2009
Jun 30,
2009
Sep 30,
2009
Dec 31,
2009
(In thousands)
Net revenues $229,407 $204,786 $328,568 $301,166 $200,000 $164,648 $269,546 $222,217
Gross profit 107,631 99,926 167,372 155,578 89,224 73,729 133,320 113,852
Marketing SG&A expenses 31,198 27,438 36,015 33,539 33,707 21,814 28,246 25,128
Other SG&A expenses 62,849 65,596 74,668 86,849 47,621 48,534 58,011 61,791
Income from operations 13,584 6,892 56,689 35,190 7,896 3,381 47,063 26,933
(As a percentage of annual totals)
Net revenues 21.6% 19.2% 30.9% 28.3% 23.4% 19.2% 31.5% 25.9%
Gross profit 20.3% 18.8% 31.6% 29.3% 21.7% 18.0% 32.5% 27.8%
Marketing SG&A expenses 24.3% 21.4% 28.1% 26.2% 31.0% 20.0% 25.9% 23.1%
Other SG&A expenses 21.7% 22.6% 25.8% 29.9% 22.0% 22.5% 26.9% 28.6%
Income from operations 12.1% 6.1% 50.5% 31.3% 9.2% 4.0% 55.2% 31.6%
Financial Position, Capital Resources and Liquidity
Our cash requirements have principally been for working capital and capital expenditures. Working capital
is primarily funded from cash flows provided by operating activities and cash and cash equivalents on hand. Our
working capital requirements generally reflect the seasonality and growth in our business as we recognize the
majority of our net revenues in the back half of the year. We fund our working capital, primarily inventory, and
capital investments from cash flows provided by operating activities, cash and cash equivalents on hand and
borrowings primarily available under our long term debt facilities. Our capital investments have included
expanding our in-store fixture and branded concept shop program, improvements and expansion of our
distribution and corporate facilities to support our growth, leasehold improvements to our new factory house and
specialty stores, and investment and improvements in information technology systems. In 2011, our capital
expenditures are expected to include the purchase, subject to certain closing conditions, of part of our corporate
office complex for $60.5 million. We intend to fund this purchase through additional debt.
Our focus remains on inventory management including improving our planning capabilities, managing our
inventory purchases, reducing our production lead times and selling excess inventory through our factory house
stores and other liquidation channels. However, we do expect several factors to contribute to inventory growth in
excess of sales growth in the first half of 2011. We are increasing our safety stock in core product offerings and
seasonal products to better meet consumer demand. Core product offerings are products that we generally plan to
have available for sale for at least the next twelve months at full price. In addition, beginning in 2011, headwear
and bags are being sold by us rather than by one of our licensees, which will also contribute to our expected year
over year inventory growth.
We believe our cash and cash equivalents on hand, cash from operations and borrowings available to us
under our revolving credit and long term debt facilities will be adequate to meet our liquidity needs and capital
expenditure requirements for at least the next twelve months. We may require additional capital to meet our
longer term liquidity and future growth needs. Although we believe we have adequate sources of liquidity over
the long term, a prolonged economic recession or a slow recovery could adversely affect our business and
liquidity (refer to the “Risk Factors” section included in Item 1A). In addition, instability in or tightening of the
capital markets could adversely affect our ability to obtain additional capital to grow our business and will affect
the cost and terms of such capital.
34