Under Armour 2010 Annual Report Download - page 54
Download and view the complete annual report
Please find page 54 of the 2010 Under Armour annual report below. You can navigate through the pages in the report by either clicking on the pages listed below, or by using the keyword search tool below to find specific information within the annual report.-
 1
1 -
2
-
3
-
4
-
5
-
6
-
7
-
8
-
9
-
10
-
11
-
12
-
13
-
14
-
15
-
16
-
17
-
18
-
19
-
20
-
21
-
22
-
23
-
24
-
25
-
26
-
27
-
28
-
29
-
30
-
31
-
32
-
33
-
34
-
35
-
36
-
37
-
38
-
39
-
40
-
41
-
42
-
43
-
 44
44 -
 45
45 -
 46
46 -
 47
47 -
 48
48 -
 49
49 -
 50
50 -
 51
51 -
 52
52 -
 53
53 -
 54
54 -
 55
55 -
 56
56 -
 57
57 -
 58
58 -
 59
59 -
 60
60 -
 61
61 -
 62
62 -
 63
63 -
 64
64 -
65
-
66
-
67
-
68
-
69
-
70
-
71
-
72
-
73
-
74
-
75
-
76
-
77
-
78
-
79
-
80
-
81
-
82
-
83
-
84
-
85
-
86
-
87
-
88
-
89
-
90
-
91
-
92
 |
 |

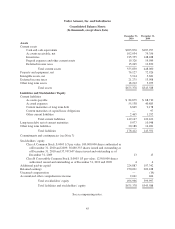
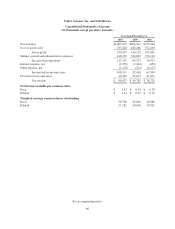
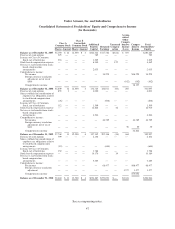
Under Armour, Inc. and Subsidiaries
Consolidated Statements of Income
(In thousands, except per share amounts)
Year Ended December 31,
2010 2009 2008
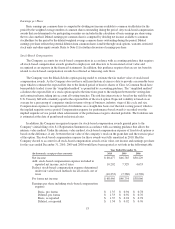
Net revenues $1,063,927 $856,411 $725,244
Cost of goods sold 533,420 446,286 372,203
Gross profit 530,507 410,125 353,041
Selling, general and administrative expenses 418,152 324,852 276,116
Income from operations 112,355 85,273 76,925
Interest expense, net (2,258) (2,344) (850)
Other expense, net (1,178) (511) (6,175)
Income before income taxes 108,919 82,418 69,900
Provision for income taxes 40,442 35,633 31,671
Net income $ 68,477 $ 46,785 $ 38,229
Net income available per common share
Basic $ 1.35 $ 0.94 $ 0.78
Diluted $ 1.34 $ 0.92 $ 0.76
Weighted average common shares outstanding
Basic 50,798 49,848 49,086
Diluted 51,282 50,650 50,342
See accompanying notes.
46