Under Armour 2010 Annual Report Download - page 63
Download and view the complete annual report
Please find page 63 of the 2010 Under Armour annual report below. You can navigate through the pages in the report by either clicking on the pages listed below, or by using the keyword search tool below to find specific information within the annual report.-
 1
1 -
2
-
3
-
4
-
5
-
6
-
7
-
8
-
9
-
10
-
11
-
12
-
13
-
14
-
15
-
16
-
17
-
18
-
19
-
20
-
21
-
22
-
23
-
24
-
25
-
26
-
27
-
28
-
29
-
30
-
31
-
32
-
33
-
34
-
35
-
36
-
37
-
38
-
39
-
40
-
41
-
42
-
43
-
44
-
45
-
46
-
47
-
48
-
49
-
50
-
51
-
52
-
 53
53 -
 54
54 -
 55
55 -
 56
56 -
 57
57 -
 58
58 -
 59
59 -
 60
60 -
 61
61 -
 62
62 -
 63
63 -
 64
64 -
 65
65 -
 66
66 -
 67
67 -
 68
68 -
 69
69 -
 70
70 -
 71
71 -
 72
72 -
 73
73 -
74
-
75
-
76
-
77
-
78
-
79
-
80
-
81
-
82
-
83
-
84
-
85
-
86
-
87
-
88
-
89
-
90
-
91
-
92
 |
 |

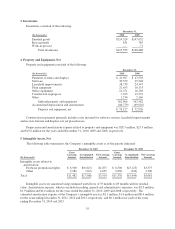
3. Inventories
Inventories consisted of the following:
December 31,
(In thousands) 2010 2009
Finished goods $214,524 $147,632
Raw materials 831 785
Work-in-process — 71
Total inventories $215,355 $148,488
4. Property and Equipment, Net
Property and equipment consisted of the following:
December 31,
(In thousands) 2010 2009
Furniture, fixtures and displays $ 41,907 $ 43,538
Software 30,579 25,548
Leasehold improvements 38,739 24,347
Plant equipment 21,653 18,153
Office equipment 21,271 16,298
Construction in progress 7,223 12,532
Other 1,534 2,166
Subtotal property and equipment 162,906 142,582
Accumulated depreciation and amortization (86,779) (69,656)
Property and equipment, net $ 76,127 $ 72,926
Construction in progress primarily includes costs incurred for software systems, leasehold improvements
and in-store fixtures and displays not yet placed in use.
Depreciation and amortization expense related to property and equipment was $28.7 million, $25.3 million
and $19.6 million for the years ended December 31, 2010, 2009 and 2008, respectively.
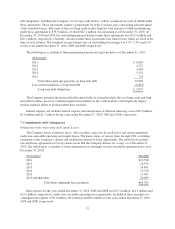
5. Intangible Assets, Net
The following table summarizes the Company’s intangible assets as of the periods indicated:
December 31, 2010 December 31, 2009
(In thousands)
Gross
Carrying
Amount
Accumulated
Amortization
Net Carrying
Amount
Gross
Carrying
Amount
Accumulated
Amortization
Net Carrying
Amount
Intangible assets subject to
amortization:
Footwear promotional rights $ 8,500 $(6,625) $1,875 $ 8,500 $(5,125) $3,375
Other 2,982 (943) 2,039 2,830 (524) 2,306
Total $11,482 $(7,568) $3,914 $11,330 $(5,649) $5,681
Intangible assets are amortized using estimated useful lives of 55 months to 89 months with no residual
value. Amortization expense, which is included in selling, general and administrative expenses, was $2.0 million,
$1.9 million and $1.6 million for the years ended December 31, 2010, 2009 and 2008, respectively. The
estimated amortization expense of the Company’s intangible assets is $2.1 million, $1.0 million and $0.6 million
for the years ending December 31, 2011, 2012 and 2013, respectively, and $0.1 million for each of the years
ending December 31, 2014 and 2015.
55