Under Armour 2006 Annual Report Download - page 59
Download and view the complete annual report
Please find page 59 of the 2006 Under Armour annual report below. You can navigate through the pages in the report by either clicking on the pages listed below, or by using the keyword search tool below to find specific information within the annual report.-
 1
1 -
2
-
3
-
4
-
5
-
6
-
7
-
8
-
9
-
10
-
11
-
12
-
13
-
14
-
15
-
16
-
17
-
18
-
19
-
20
-
21
-
22
-
23
-
24
-
25
-
26
-
27
-
28
-
29
-
30
-
31
-
32
-
33
-
34
-
35
-
36
-
37
-
38
-
39
-
40
-
41
-
42
-
43
-
44
-
45
-
46
-
47
-
48
-
 49
49 -
 50
50 -
 51
51 -
 52
52 -
 53
53 -
 54
54 -
 55
55 -
 56
56 -
 57
57 -
 58
58 -
 59
59 -
 60
60 -
 61
61 -
 62
62 -
 63
63 -
 64
64 -
 65
65 -
 66
66 -
 67
67 -
 68
68 -
 69
69 -
70
-
71
-
72
-
73
-
74
-
75
-
76
-
77
-
78
-
79
-
80
-
81
-
82
-
83
-
84
 |
 |

Under Armour, Inc. and Subsidiaries
Notes to the Consolidated Financial Statements—(Continued)
(amounts in thousands, except per share and share amounts)
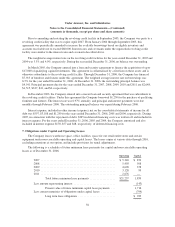
granted is calculated using an expected life equal to the time from grant to the midpoint between the vesting date
and the contractual term, while considering the vesting tranches. The risk-free interest rate is based on the yield
for the U.S. Treasury bill with a maturity equal to the expected option life. Expected volatility is based on an
average for a peer group of companies similar in terms of type of business, industry, stage of life cycle and size.
Compensation expense is recognized on a straight-line basis over the total vesting period, which is the implied
requisite service period and net of forfeitures which are estimated at the date of grant based on historical rates.
The Company recognized $1,536 in stock-based compensation expense in selling, general and administrative
expenses for the year ended December 31, 2006 in accordance with SFAS 123R.
Total stock-based compensation expense for the years ended December 31, 2006 and 2005 was $1,982 and
$1,177, respectively. No stock-based compensation expense was recorded for the year ended December 31, 2004.
As of December 31, 2006, the Company had $7,273 of unrecognized compensation expense expected to be
recognized over a weighted average period of 4.0 years.
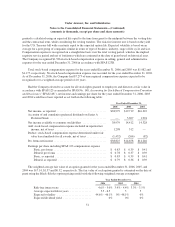
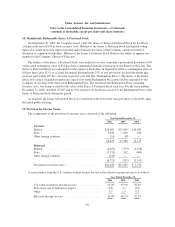
Had the Company elected to account for all stock rights granted to employees and directors at fair value in
accordance with SFAS 123 as amended by SFAS No. 148, Accounting for Stock-Based Compensation Transition
and Disclosure (“SFAS 148”), net income and earnings per share for the years ended December 31, 2006, 2005
and 2004 would have been reported as set forth in the following table:
Year Ended December 31,
2006 2005 2004
Net income, as reported ................................... $38,979 $19,719 $16,322
Accretion of and cumulative preferred dividends on Series A
Preferred Stock ........................................ — 5,307 1,994
Net income available to common stockholders ................. 38,979 14,412 14,328
Add: stock-based compensation expense included in reported net
income, net of taxes .................................... 1,298 512 —
Deduct: stock-based compensation expense determined under fair
value based methods for all awards, net of taxes .............. (1,452) (266) (82)
Pro forma net income ..................................... $38,825 $14,658 $14,246
Earnings per share including SFAS 123 compensation expense
Basic, pro forma ..................................... $ 0.83 $ 0.39 $ 0.41
Diluted, pro forma ................................... $ 0.78 $ 0.37 $ 0.39
Basic, as reported .................................... $ 0.83 $ 0.39 $ 0.41
Diluted, as reported .................................. $ 0.79 $ 0.36 $ 0.39
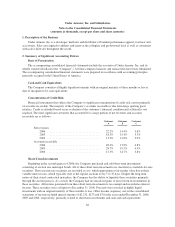
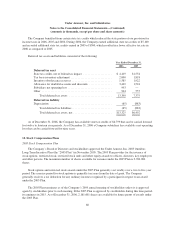
The weighted average fair value of an option granted for the years ended December 31, 2006, 2005, and
2004 was $17.14, $1.57 and $0.32, respectively. The fair value of each option granted is estimated on the date of
grant using the Black-Scholes option-pricing model with the following weighted average assumptions:
Year Ended December 31,
2006 2005 2004
Risk-free interest rate ...................... 4.6% - 5.0% 3.9% - 4.4% 3.3% - 3.5%
Average expected life in years ............... 5.5-6.5 5 5
Expected volatility ........................ 44.6% - 46.1% 0% -48.1% 0%
Expected dividend yield .................... 0% 0% 0%
51