Under Armour 2006 Annual Report Download - page 37
Download and view the complete annual report
Please find page 37 of the 2006 Under Armour annual report below. You can navigate through the pages in the report by either clicking on the pages listed below, or by using the keyword search tool below to find specific information within the annual report.-
 1
1 -
2
-
3
-
4
-
5
-
6
-
7
-
8
-
9
-
10
-
11
-
12
-
13
-
14
-
15
-
16
-
17
-
18
-
19
-
20
-
21
-
22
-
23
-
24
-
25
-
26
-
 27
27 -
 28
28 -
 29
29 -
 30
30 -
 31
31 -
 32
32 -
 33
33 -
 34
34 -
 35
35 -
 36
36 -
 37
37 -
 38
38 -
 39
39 -
 40
40 -
 41
41 -
 42
42 -
 43
43 -
 44
44 -
 45
45 -
 46
46 -
 47
47 -
48
-
49
-
50
-
51
-
52
-
53
-
54
-
55
-
56
-
57
-
58
-
59
-
60
-
61
-
62
-
63
-
64
-
65
-
66
-
67
-
68
-
69
-
70
-
71
-
72
-
73
-
74
-
75
-
76
-
77
-
78
-
79
-
80
-
81
-
82
-
83
-
84
 |
 |
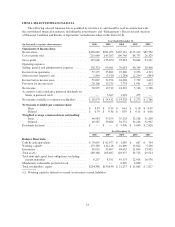
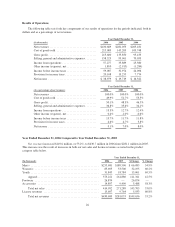
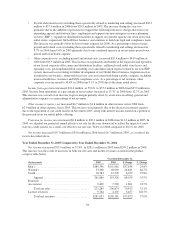
Net sales increased $70.4 million, or 35.1%, to $271.3 million in 2005 from $200.9 million in 2004 as noted
in the table above. The increase in net sales primarily reflects:
• continued unit volume growth of our existing products sold to retail customers, while pricing of
existing products remained relatively unchanged; and
• product introductions which in 2005 accounted for $29.0 million of the increase in net sales primarily
in our compression and training products.
License revenues increased $5.5 million, or 126.7%, to $9.8 million in 2005 from $4.3 million in 2004. This
increase in license revenues was a result of increased sales by our licensees due to increased distribution,
continued unit volume growth and new product offerings.
Gross profit increased $40.5 million to $135.9 million in 2005 from $95.4 million in 2004. Gross profit as a
percentage of net revenues, or gross margin, increased 180 basis points to 48.3% in 2005 from 46.5% in 2004.
This increase in gross margin was primarily driven by the following:
• increased license revenues, accounting for an approximate 70 basis point increase;
• lower product costs as a result of greater supplier discounts for increased volume and lower cost
sourcing arrangements, accounting for an approximate 240 basis point increase; partially offset by
• larger customer incentives, partially offset by more accurate demand forecasting and better inventory
management, accounting for an approximate 50 basis point decrease; and
• higher handling costs to make products to customer specifications for immediate display in their stores
and higher overhead costs associated with our quick-turn, Special Make-Up Shop, which was instituted
in June 2004, accounting for an approximate 70 basis point decrease.
Selling, general and administrative expenses increased $29.9 million to $100.0 million in 2005 from $70.1
million in 2004. As a percentage of net revenues, selling, general and administrative expenses increased to 35.6%
in 2005 from 34.1% in 2004. These changes were primarily attributable to the following:
• Marketing costs increased $8.7 million to $30.5 million in 2005 from $21.8 million in 2004. The
increase in these costs was due to increased advertising costs from our women’s media campaign,
marketing salaries, and depreciation expense related to our in-store fixture program. As a percentage of
net revenues, marketing costs increased slightly to 10.9% in 2005 from 10.6% in 2004 due to the
increased costs described above.
• Selling costs increased $5.4 million to $17.1 million in 2005 from $11.7 million in 2004. This increase
was due to increased headcount in our sales force and startup costs associated with our international
growth initiatives. As a percentage of net revenues, selling costs increased to 6.1% in 2005 from 5.7%
in 2004 due to the increased costs described above.
• Payroll and related costs (excluding those specifically related to marketing and selling) increased $8.6
million to $26.9 million in 2005, from $18.3 million in 2004. The increase during 2005 was due to the
following initiatives: we began to build our team to design and source our footwear line, which we
began shipping in June 2006; we added personnel to our information technology team to support our
Company-wide initiative to upgrade our information systems; we incurred equity compensation costs;
we added personnel to operate our three new retail outlet stores; and we invested in the personnel
needed to enhance our compliance function and operate as a public company. As a percentage of net
revenues, payroll and related costs (excluding those specifically related to marketing and selling)
increased to 9.6% in 2005 from 8.9% in 2004 due to the items described above.
• Other corporate costs increased $7.2 million to $25.5 million in 2005, from $18.3 million in 2004. This
increase was attributable to higher costs in support of our footwear initiative, freight and duty related to
increased Canada sales, expansion of our leased corporate office space and distribution facility, and
costs associated with being a public company. As a percentage of net revenues, other corporate costs
were 9.1% in 2005, which is a slight increase from 8.9% in 2004 due to the items noted above.
29