Under Armour 2006 Annual Report Download - page 38
Download and view the complete annual report
Please find page 38 of the 2006 Under Armour annual report below. You can navigate through the pages in the report by either clicking on the pages listed below, or by using the keyword search tool below to find specific information within the annual report.-
 1
1 -
2
-
3
-
4
-
5
-
6
-
7
-
8
-
9
-
10
-
11
-
12
-
13
-
14
-
15
-
16
-
17
-
18
-
19
-
20
-
21
-
22
-
23
-
24
-
25
-
26
-
27
-
 28
28 -
 29
29 -
 30
30 -
 31
31 -
 32
32 -
 33
33 -
 34
34 -
 35
35 -
 36
36 -
 37
37 -
 38
38 -
 39
39 -
 40
40 -
 41
41 -
 42
42 -
 43
43 -
 44
44 -
 45
45 -
 46
46 -
 47
47 -
 48
48 -
49
-
50
-
51
-
52
-
53
-
54
-
55
-
56
-
57
-
58
-
59
-
60
-
61
-
62
-
63
-
64
-
65
-
66
-
67
-
68
-
69
-
70
-
71
-
72
-
73
-
74
-
75
-
76
-
77
-
78
-
79
-
80
-
81
-
82
-
83
-
84
 |
 |

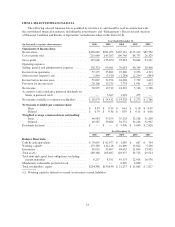
Income from operations increased $10.5 million, or 41.4%, to $35.9 million in 2005 from $25.4 million in
2004. Income from operations as a percentage of net revenues increased to 12.7% in 2005 from 12.4% in 2004.
This increase was a result of an increase in gross margin partially offset by an increase in selling, general and
administrative expenses as a percentage of net revenues.
Other income (expense), net increased $1.6 million to $2.9 million in other expense, net in 2005 from
$1.3 million in other expense, net in 2004. This increase was primarily due to higher average borrowings and a
higher effective interest rate under our credit facility prior to being repaid in November 2005 with proceeds from
the initial public offering.
Provision for income taxes increased $5.5 million to $13.3 million in 2005 from $7.8 million in 2004. For
the year ended December 31, 2005 our effective tax rate was 40.2% compared to 32.3% in 2004. This increase
was primarily due to an increase in our effective state tax rate, which reflected reduced state tax credits earned as
a percentage of income before taxes.
Net income increased $3.4 million to $19.7 million in 2005 from $16.3 million in 2004, as a result of the
factors described above.
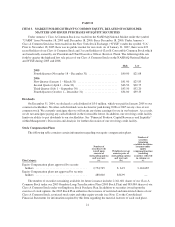
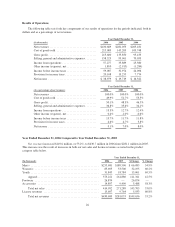
Seasonality
Historically, we have recognized approximately 70-75% of our income from operations in the last two
quarters of the year, driven by increased sales volume of our products during the fall selling season, reflecting
our historical strength in fall sports, and the seasonality of our higher priced ColdGear®line. Approximately
61%, 62% and 66% of our net revenues were generated during the last two quarters of 2006, 2005 and 2004,
respectively. The level of our working capital reflects the seasonality and growth in our business. We generally
expect inventory, accounts payable and accrued expenses to be higher in the second and third quarters in
preparation for the fall selling season.
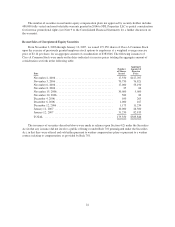
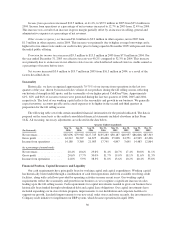
The following table sets forth certain unaudited financial information for the periods indicated. The data is
prepared on the same basis as the audited consolidated financial statements included elsewhere in this Form
10-K. All recurring, necessary adjustments are reflected in the data below.
Quarter Ended (unaudited)
(In thousands)
Mar 31,
2006
Jun 30,
2006
Sep 30,
2006
Dec 31,
2006
Mar 31,
2005
Jun 30,
2005
Sep 30,
2005
Dec 31,
2005
Net revenues ................. $87,696 $79,965 $127,745 $135,283 $58,187 $48,957 $86,606 $87,303
Gross profit ................. 44,312 38,207 64,675 68,406 25,838 24,551 42,965 42,496
Income from operations ........ 14,180 3,369 21,983 17,745 4,897 3,645 14,483 12,864
(As a percentage of annual totals)
Net revenues ................. 20.4% 18.6% 29.6% 31.4% 20.7% 17.4% 30.8% 31.1%
Gross profit ................. 20.6% 17.7% 30.0% 31.7% 19.0% 18.1% 31.6% 31.3%
Income from operations ........ 24.8% 5.9% 38.3% 31.0% 13.6% 10.2% 40.4% 35.8%
Financial Position, Capital Resources and Liquidity
Our cash requirements have principally been for working capital and capital expenditures. Working capital
has historically been funded through a combination of cash from operations and from available revolving credit
facilities, along with cash flows provided by operating activities in more recent years. Our working capital
requirements reflect the seasonality and growth in our business as we recognize a significant increase in sales
leading up to the fall selling season. Cash requirements for capital investments needed to grow our business have
historically been funded through subordinated debt and capital lease obligations. Our capital investments have
included expanding our in-store fixture program, improvements to our distribution and corporate facilities to
support our growth, leasehold improvements to our new retail outlet stores and more recently, the investment in a
Company-wide initiative to implement our ERP system, which became operational in April 2006.
30