Under Armour 2006 Annual Report Download - page 39
Download and view the complete annual report
Please find page 39 of the 2006 Under Armour annual report below. You can navigate through the pages in the report by either clicking on the pages listed below, or by using the keyword search tool below to find specific information within the annual report.-
 1
1 -
2
-
3
-
4
-
5
-
6
-
7
-
8
-
9
-
10
-
11
-
12
-
13
-
14
-
15
-
16
-
17
-
18
-
19
-
20
-
21
-
22
-
23
-
24
-
25
-
26
-
27
-
28
-
 29
29 -
 30
30 -
 31
31 -
 32
32 -
 33
33 -
 34
34 -
 35
35 -
 36
36 -
 37
37 -
 38
38 -
 39
39 -
 40
40 -
 41
41 -
 42
42 -
 43
43 -
 44
44 -
 45
45 -
 46
46 -
 47
47 -
 48
48 -
 49
49 -
50
-
51
-
52
-
53
-
54
-
55
-
56
-
57
-
58
-
59
-
60
-
61
-
62
-
63
-
64
-
65
-
66
-
67
-
68
-
69
-
70
-
71
-
72
-
73
-
74
-
75
-
76
-
77
-
78
-
79
-
80
-
81
-
82
-
83
-
84
 |
 |

Cash and cash equivalents increased to $70.7 million at December 31, 2006 compared to $63.0 million at
December 31, 2005 and our working capital increased to $173.4 million at December 31, 2006 compared to
$134.1 million at December 31, 2005. This increase in our financial position is primarily the result of increased
levels of inventory and accounts receivable due to the 53.2% growth in net revenues.
We believe that our cash and cash equivalents on hand, cash from operations and borrowings available to us
under our senior and subordinated debt facilities will be adequate to meet our liquidity needs and capital
expenditure requirements for at least the next twelve months.
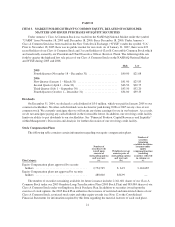
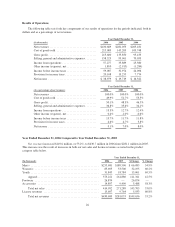
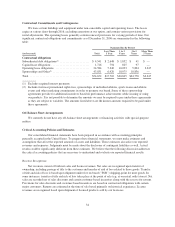
Cash Flows
The following table presents the major components of net cash flows provided by and used in operating,
investing and financing activities for the years presented:
Year Ended December 31,
(in thousands) 2006 2005 2004
Net cash provided (used in) by:
Operating activities ............................. $10,701 $ 15,795 $ (8,851)
Investing activities .............................. (15,115) (10,833) (8,683)
Financing activities ............................. 12,579 56,989 18,004
Effect of exchange rate changes on cash and cash
equivalents .................................. (487) (59) (52)
Net increase in cash and cash equivalents ............ $ 7,678 $ 61,892 $ 418
Operating Activities
Operating activities consist primarily of net income adjusted for certain non-cash items, including
depreciation, deferred income taxes, changes in reserves for doubtful accounts, returns, discounts and inventories
and the effect of changes in operating assets and liabilities, principally accounts receivable, inventories, accounts
payable and accrued expenses.
Cash provided by operating activities decreased $5.1 million to $10.7 million in 2006 compared to $15.8
million in 2005. This decrease was due to higher cash outflows from operating assets and liabilities of $22.9
million and an increase in non-cash items of $1.4 million, offset by an increase in net income of $19.3 million
period-over period. The increase in cash outflows from operating assets and liabilities period-over-period was
primarily due to an increase in inventory levels of $20.8 million to support our 53.2% sales growth and a $3.5
million increase in income taxes receivable due to higher federal and state income tax payments made during
2006 compared to tax payments made during 2005.
Non-cash items decreased primarily as a result of decreased cash outflows relating to deferred income tax
assets due to increased state tax credits earned in 2006. In addition, depreciation and amortization increased
period-over-period primarily due to the implementation of our new ERP system, acquisition of additional assets
and retail outlet store leasehold improvements.
Cash provided by operating activities increased $24.7 million to $15.8 million in 2005 compared to cash
used in operating activities of $8.9 million in 2004. The increase was due to an increase in net income and
non-cash items of $3.4 million and $5.6 million, respectively, coupled with lower cash outflows from operating
assets and liabilities of $15.7 million. Non-cash items increased primarily as a result of higher depreciation and
amortization from the acquisition of additional assets and current period stock compensation. The net decrease in
cash outflows from operating assets and liabilities was primarily the result of improved inventory management
due to better forecasting of sales and delivery of inventory which reduced the build up of inventory levels year
over year. Cash outflows from income taxes payable increased due to higher federal and state income tax
payments during 2005 compared to tax payments made during 2004 and cash outflows from accrued expenses
increased due to higher bonus payments during 2005 compared to 2004.
31