Under Armour 2006 Annual Report Download - page 34
Download and view the complete annual report
Please find page 34 of the 2006 Under Armour annual report below. You can navigate through the pages in the report by either clicking on the pages listed below, or by using the keyword search tool below to find specific information within the annual report.-
 1
1 -
2
-
3
-
4
-
5
-
6
-
7
-
8
-
9
-
10
-
11
-
12
-
13
-
14
-
15
-
16
-
17
-
18
-
19
-
20
-
21
-
22
-
23
-
 24
24 -
 25
25 -
 26
26 -
 27
27 -
 28
28 -
 29
29 -
 30
30 -
 31
31 -
 32
32 -
 33
33 -
 34
34 -
 35
35 -
 36
36 -
 37
37 -
 38
38 -
 39
39 -
 40
40 -
 41
41 -
 42
42 -
 43
43 -
 44
44 -
45
-
46
-
47
-
48
-
49
-
50
-
51
-
52
-
53
-
54
-
55
-
56
-
57
-
58
-
59
-
60
-
61
-
62
-
63
-
64
-
65
-
66
-
67
-
68
-
69
-
70
-
71
-
72
-
73
-
74
-
75
-
76
-
77
-
78
-
79
-
80
-
81
-
82
-
83
-
84
 |
 |

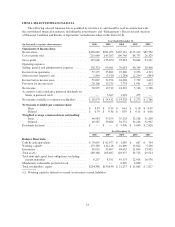
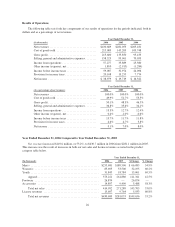
Results of Operations
The following table sets forth key components of our results of operations for the periods indicated, both in
dollars and as a percentage of net revenues.
Year Ended December 31,
(In thousands) 2006 2005 2004
Net revenues ................................. $430,689 $281,053 $205,181
Cost of goods sold ............................ 215,089 145,203 109,748
Gross profit .................................. 215,600 135,850 95,433
Selling, general and administrative expenses ........ 158,323 99,961 70,053
Income from operations ........................ 57,277 35,889 25,380
Other income (expense), net ..................... 1,810 (2,915) (1,284)
Income before income taxes ..................... 59,087 32,974 24,096
Provision for income taxes ...................... 20,108 13,255 7,774
Net income .................................. $ 38,979 $ 19,719 $ 16,322
Year Ended December 31,
(As a percentage of net revenues) 2006 2005 2004
Net revenues ................................. 100.0% 100.0% 100.0%
Cost of goods sold ............................ 49.9% 51.7% 53.5%
Gross profit .................................. 50.1% 48.3% 46.5%
Selling, general and administrative expenses ........ 36.8% 35.6% 34.1%
Income from operations ........................ 13.3% 12.7% 12.4%
Other income (expense), net ..................... 0.4% -1.0% -0.6%
Income before income taxes ..................... 13.7% 11.7% 11.8%
Provision for income taxes ...................... 4.6% 4.7% 3.8%
Net income .................................. 9.1% 7.0% 8.0%
Year Ended December 31, 2006 Compared to Year Ended December 31, 2005
Net revenues increased $149.6 million, or 53.2%, to $430.7 million in 2006 from $281.1 million in 2005.
This increase was the result of increases in both our net sales and license revenues as noted in the product
category table below.
Year Ended December 31,
(In thousands) 2006 2005 $ Change % Change
Men’s ................................................ $255,681 $189,596 $ 66,085 34.9%
Women’s ............................................. 85,695 53,500 32,195 60.2%
Youth ................................................ 31,845 18,784 13,061 69.5%
Apparel ........................................... 373,221 261,880 111,341 42.5%
Footwear ............................................. 26,874 — 26,874 —
Accessories ........................................... 14,897 9,409 5,488 58.3%
Total net sales ..................................... 414,992 271,289 143,703 53.0%
License revenues ....................................... 15,697 9,764 5,933 60.8%
Total net revenues .................................. $430,689 $281,053 $149,636 53.2%
26