Toshiba 2011 Annual Report Download - page 7
Download and view the complete annual report
Please find page 7 of the 2011 Toshiba annual report below. You can navigate through the pages in the report by either clicking on the pages listed below, or by using the keyword search tool below to find specific information within the annual report.-
 1
1 -
 2
2 -
 3
3 -
 4
4 -
 5
5 -
 6
6 -
 7
7 -
 8
8 -
 9
9 -
 10
10 -
 11
11 -
 12
12 -
 13
13 -
 14
14 -
 15
15 -
 16
16 -
 17
17 -
 18
18 -
19
-
20
-
21
-
22
-
23
-
24
-
25
-
26
-
27
-
28
-
29
-
30
-
31
-
32
-
33
-
34
-
35
-
36
-
37
-
38
-
39
-
40
-
41
-
42
-
43
-
44
-
45
-
46
-
47
-
48
-
49
-
50
-
51
-
52
-
53
-
54
-
55
-
56
-
57
-
58
-
59
-
60
-
61
-
62
-
63
-
64
-
65
-
66
-
67
-
68
-
69
-
70
-
71
-
72
-
73
-
74
-
75
-
76
-
77
-
78
-
79
-
80
-
81
-
82
-
83
-
84
-
85
-
86
-
87
-
88
-
89
-
90
-
91
-
92
-
93
-
94
-
95
-
96
-
97
-
98
-
99
-
100
-
101
-
102
-
103
-
104
-
105
-
106
-
107
-
108
-
109
-
110
-
111
-
112
-
113
-
114
-
115
-
116
-
117
-
118
-
119
-
120
-
121
-
122
-
123
-
124
-
125
-
126
-
127
-
128
-
129
-
130
 |
 |

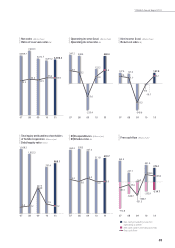
6,859.7
7,404.3
6,512.7 6,291.2 6,398.5
10090807 11
1,108.3
1,022.3
447.3
797.4
868.1
10090807 11
365.3 370.3 357.5
311.8 319.7
10090807 11
247.2 240.4
-233.4
125.2
240.3
10090807 11
137.4 127.4
-343.6
137.8
10090807 11
-19.7
561.5
-712.8
247.1
374.1
-214.7
10090807 11
451.4
-252.9
-16.0
1.0
5.3 5.5
5.0 5.0
5.0
1.2
4.0
51.2
53.5
52.5
55.6 55.4
3.6
3.2
-3.6
2.0
3.8
1.5
-151.3
-75.6
-351.3
198.5
159.4
1.2
3,227
3,353
-322.7
-335.3
2.0
1.7
-5.3
-0.3
2.2
Net cash provided by (used in)
operating activities
Net cash used in investing activities
Free cash flow
Operating income (loss) (Billions of yen)
Operating income ratio (%)
R&D expenditures (Billions of yen)
R&D/sales ratio (%)
Net sales (Billions of yen)
Ratio of overseas sales (%)
Total equity attributable to shareholders
of Toshiba Corporation
(Billions of yen)
Debt/equity ratio (Times)
Net income (loss) (Billions of yen)
Return on sales (%)
Free cash flow (Billions of yen)
TOSHIBA Annual Report 2011
05
A01_東芝様AR2011_前半.indd 05 11.8.15 5:14:21 PM