Toshiba 2011 Annual Report Download - page 6
Download and view the complete annual report
Please find page 6 of the 2011 Toshiba annual report below. You can navigate through the pages in the report by either clicking on the pages listed below, or by using the keyword search tool below to find specific information within the annual report.-
 1
1 -
 2
2 -
 3
3 -
 4
4 -
 5
5 -
 6
6 -
 7
7 -
 8
8 -
 9
9 -
 10
10 -
 11
11 -
 12
12 -
 13
13 -
 14
14 -
 15
15 -
 16
16 -
 17
17 -
18
-
19
-
20
-
21
-
22
-
23
-
24
-
25
-
26
-
27
-
28
-
29
-
30
-
31
-
32
-
33
-
34
-
35
-
36
-
37
-
38
-
39
-
40
-
41
-
42
-
43
-
44
-
45
-
46
-
47
-
48
-
49
-
50
-
51
-
52
-
53
-
54
-
55
-
56
-
57
-
58
-
59
-
60
-
61
-
62
-
63
-
64
-
65
-
66
-
67
-
68
-
69
-
70
-
71
-
72
-
73
-
74
-
75
-
76
-
77
-
78
-
79
-
80
-
81
-
82
-
83
-
84
-
85
-
86
-
87
-
88
-
89
-
90
-
91
-
92
-
93
-
94
-
95
-
96
-
97
-
98
-
99
-
100
-
101
-
102
-
103
-
104
-
105
-
106
-
107
-
108
-
109
-
110
-
111
-
112
-
113
-
114
-
115
-
116
-
117
-
118
-
119
-
120
-
121
-
122
-
123
-
124
-
125
-
126
-
127
-
128
-
129
-
130
 |
 |

Notes:1. U.S. GAAP was codifi ed by the Financial Accounting Standards Board. Beginning with the fi scal year ended March 31, 2010, the codifi ed standards are described in “Accounting Standards
Codifi cation (ASC).”
2. Operating income (loss) is derived by deducting the cost of sales and selling, general and administrative expenses from net sales.
3. Net income (loss) attributable to shareholders of Toshiba Corporation is described as Net income (loss).
4. Equity attributable to shareholders of Toshiba Corporation is based on U.S. GAAP.
5. ROI = Operating income (loss) / (Average equity attributable to shareholders of Toshiba Corporation + Average equity attributable to noncontrolling interests + Average interest-bearing
debt) × 100
6. Basic earnings (losses) per share attributable to shareholders of Toshiba Corporation (EPS) is computed based on the weighted-average number of shares of common stock outstanding
during each period. Diluted EPS assumes the dilution that could occur if convertible bonds were converted or stock acquisition rights were exercised to issue common stock, unless their
inclusion would have an antidilutive effect.
7. On June 17, 2010, Toshiba Corporation and Fujitsu Limited (“Fujitsu”) signed a Memorandum of Understanding to merge their mobile phone businesses, followed by a defi nitive
contract on July 29, 2010. On October 1, 2010, Toshiba Corporation transferred its mobile phone business to a newly established company called Fujitsu Toshiba Mobile
Communications Limited, and sold 80.1% of the shares of the new company to Fujitsu. The results of the mobile phone business are not incorporated into consolidated net
sales, operating income (loss), or income (loss) from continuing operations, before income taxes and noncontrolling interests in the consolidated results. Prior-period data
relating to the discontinued operations has been reclassifi ed in accordance with ASC No.205-20, “Presentation of Financial Statements —Discontinued Operations.”
8. The Mobile Broadcasting business ceased operation at the end of the fi scal year ended March 31, 2009. Prior-period data from the fi scal year ended March 31,
2008 has been reclassifi ed to conform with the current classifi cation.
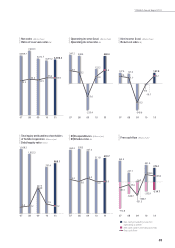
(Billions of yen)
2011 2010 2009 2008 2007
Financial performance
Net sales—Japan ¥2,851.8 ¥2,791.3 ¥3,093.7 ¥3,445.4 ¥3,349.4
—Overseas 3,546.7 3,499.9 3,419.0 3,958.9 3,510.3
Net sales (Total) 6,398.5 6,291.2 6,512.7 7,404.3 6,859.7
Operating income (loss) (Note 2) 240.3 125.2 (233.4) 240.4 247.2
Income (loss) from continuing operations,
before income taxes and noncontrolling interests
195.5 34.4 (261.5) 258.1 315.9
Net income (loss) (Note 3) 137.8 (19.7) (343.6) 127.4 137.4
Financial position and indicators
Total assets 5,379.3 5,451.2 5,453.2 5,935.6 5,932.0
Equity attributable to shareholders
of Toshiba Corporation (Note 4) 868.1 797.4 447.3 1,022.3 1,108.3
Interest-bearing debt 1,081.3 1,218.3 1,810.7 1,261.0 1,158.5
Shareholders’ equity ratio (%) 16.1 14.6 8.2 17.2 18.7
Debt/equity ratio (Times) 1.2 1.5 4.0 1.2 1.0
Investment
R&D expenditures 319.7 311.8 357.5 370.3 365.3
Capital expenditures (Property, plant and equipment)
231.0 209.4 355.5 464.5 373.8
Return indicators
Return on investment (ROI) (%) (Note 5) 10.4 5.1 (8.9) 9.2 10.6
Return on equity (ROE) (%) 16.6 (3.2) (46.8) 12.0 13.0
Free cash fl ow
Net cash provided by (used in) operating activities
374.1 451.4 (16.0) 247.1 561.5
Net cash used in investing activities (214.7) (252.9) (335.3) (322.7) (712.8)
Free cash fl ow 159.4 198.5 (351.3) (75.6) (151.3)
Per share of common stock (yen)
Net income (loss) (Note 6)
—basic 32.55 (4.93) (106.18) 39.46 42.76
—diluted 31.25 (4.93) (106.18) 36.59 39.45
Cash dividends 5.00 0.00 5.00 12.00 11.00
Number of employees
Number of employees (Thousands) 203 204 199 198 191
Financial Highlights • Toshiba Corporation and its
Subsidiaries
For the years ended March 31, 2011, 2010, 2009, 2008 and 2007
04
A01_東芝様AR2011_前半.indd 04 11.8.15 5:14:21 PM