TomTom 2006 Annual Report Download - page 61
Download and view the complete annual report
Please find page 61 of the 2006 TomTom annual report below. You can navigate through the pages in the report by either clicking on the pages listed below, or by using the keyword search tool below to find specific information within the annual report.-
 1
1 -
2
-
3
-
4
-
5
-
6
-
7
-
8
-
9
-
10
-
11
-
12
-
13
-
14
-
15
-
16
-
17
-
18
-
19
-
20
-
21
-
22
-
23
-
24
-
25
-
26
-
27
-
28
-
29
-
30
-
31
-
32
-
33
-
34
-
35
-
36
-
37
-
38
-
39
-
40
-
41
-
42
-
43
-
44
-
45
-
46
-
47
-
48
-
49
-
50
-
 51
51 -
 52
52 -
 53
53 -
 54
54 -
 55
55 -
 56
56 -
 57
57 -
 58
58 -
 59
59 -
 60
60 -
 61
61 -
 62
62 -
 63
63 -
 64
64 -
 65
65 -
 66
66 -
 67
67 -
 68
68 -
 69
69 -
 70
70 -
 71
71 -
72
-
73
 |
 |

59 TomTom Annual Report 2006Notes to the Financial Statements of TomTom NV
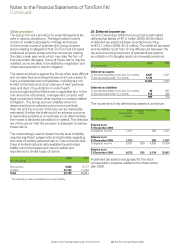
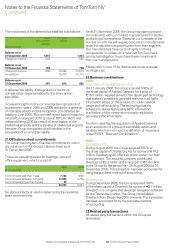
Notes to the Financial Statements of TomTom NV
Continued
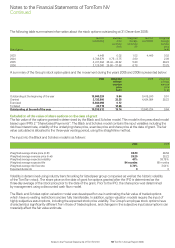
The following table summarises information about the stock options outstanding at 31 December 2006:
Number Exercise Weighted Number Weighted
outstanding price average exercisable average
per share remaining exercise
(in ) life price
Year of grant (in )
2003 4,449 0.02 1.02 4,449 0.02
2004 3,746,579 0.75 – 3.75 2.60 2.09
2005 4,417,484 26.44 – 28.82 5.80 28.22
2006 2,125,000 25.50 – 37.68 6.78 33.25
A summary of the Group’s stock option plans and the movement during the years 2005 and 2006 is presented below:
2006 Weighted 2005 Weighted
average average
exercise exercise
price price
(in )(in )
Outstanding at the beginning of the year 13,840,224 9.64 9,415,240 0.91
Granted 2,132,500 33.25 4,424,984 28.22
Exercised -5,640,093 0.12
Forfeited -39,119 12.86
Outstanding at the end of the year 10,293,512 19.74 13,840,224 9.64
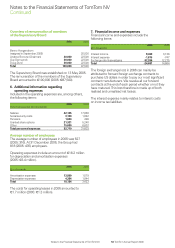
Calculation of the value of share options on the date of grant
The fair value of the options granted is determined by the Black and Scholes model. This model is the prescribed model
based upon IFRS 2 “Share-based Payments”. The Black and Scholes model contains the input variables including the
risk-free interest rate, volatility of the underlying share price, exercise price and share price at the date of grant. The fair
value calculated is allocated to the three-year vesting period, using the straight-line method.
The input into the Black and Scholes model is as follows:
2006 2005
Weighted average share price (in )33.23 28.58
Weighted average exercise price (in )33.25 28.22
Weighted average expected volatility 40% 38.75%
Weighted average expected life 84 months 68 months
Weighted average risk-free rate 3.74% 3.04%
Expected dividends 00
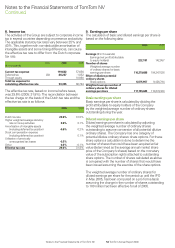
Volatility is determined using industry benchmarking for listed peer group companies as well as the historic volatility
of the TomTom stock. The share price on the date of grant for options granted after the IPO is determined as the
three-day average of the stock price prior to the date of the grant. Prior to the IPO, the share price was determined
by management using a discounted cash flow model.
The Black and Scholes option valuation model was developed for use in estimating the fair value of traded options
which have no vesting restrictions and are fully transferable. In addition, option valuation models require the input of
highly subjective assumptions, including the expected stock price volatility. The Group’s employee stock options have
characteristics significantly different from those of traded options, and changes in the subjective input assumptions can
materially affect the fair value estimate.