TomTom 2006 Annual Report Download - page 53
Download and view the complete annual report
Please find page 53 of the 2006 TomTom annual report below. You can navigate through the pages in the report by either clicking on the pages listed below, or by using the keyword search tool below to find specific information within the annual report.-
 1
1 -
2
-
3
-
4
-
5
-
6
-
7
-
8
-
9
-
10
-
11
-
12
-
13
-
14
-
15
-
16
-
17
-
18
-
19
-
20
-
21
-
22
-
23
-
24
-
25
-
26
-
27
-
28
-
29
-
30
-
31
-
32
-
33
-
34
-
35
-
36
-
37
-
38
-
39
-
40
-
41
-
42
-
 43
43 -
 44
44 -
 45
45 -
 46
46 -
 47
47 -
 48
48 -
 49
49 -
 50
50 -
 51
51 -
 52
52 -
 53
53 -
 54
54 -
 55
55 -
 56
56 -
 57
57 -
 58
58 -
 59
59 -
 60
60 -
 61
61 -
 62
62 -
 63
63 -
64
-
65
-
66
-
67
-
68
-
69
-
70
-
71
-
72
-
73
 |
 |

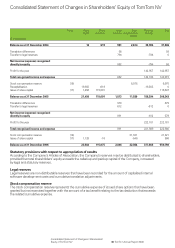
51 TomTom Annual Report 2006Notes to the Financial Statements of TomTom NV
Notes to the Financial Statements of TomTom NV
Continued
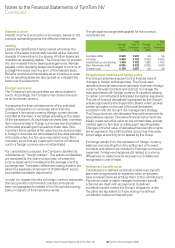
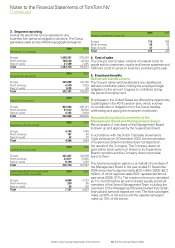
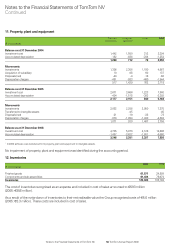
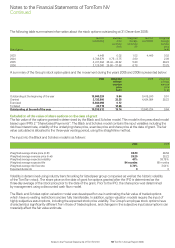
3. Segment reporting
During the period the Group operated in one
business line; personal navigation solutions. The Group
generates sales across different geographical regions.
2006 2005
Revenue (in thousands)
Europe 1,226,331 670,416
North America 106,238 42,320
Rest of world 31,189 7,295
Total 1,363,758 720,031
2006 2005
Net profit (in thousands)
Europe 225,892 144,126
North America -4,739 -1,228
Rest of world 1,028 59
Total 222,181 142,957
2006 2005
Assets (in thousands)
Europe 803,494 409,191
North America 91,312 50,500
Rest of world 8,162 3,909
Total 902,968 463,600
2006 2005
Depreciation (in thousands)
Europe 4,145 1,760
North America 187 54
Rest of world 62 30
Total 4,394 1,844
2006 2005
Liabilities (in thousands)
Europe 322,421 142,299
North America 23,617 13,665
Rest of world 6,140 1,293
Total 352,178 157,257
Capital expenditures on property, plant 2006 2005
and equipment (in thousands)
Europe 6,866 4,733
North America 230 65
Rest of world 55 159
Total 7,151 4,957
2006 2005
Number of employees at year end
Europe 715 385
North America 56 32
Rest of world 47 18
Total 818 435
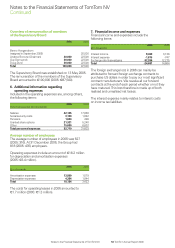
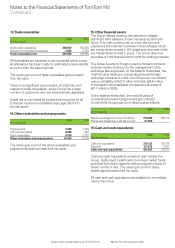
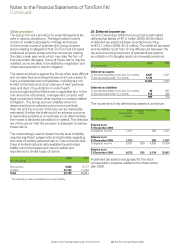
4. Cost of sales
The Group’s cost of sales consists of material costs for
goods sold to customers, royalty and licence expenses and
fulfilment costs incurred on inventory sold during the year.
5. Employee benefits
Retirement benefit scheme
The Group’s retirement benefit plans are classified as
defined contribution plans, limiting the employer’s legal
obligation to the amount it agrees to contribute during
the period of employment.
Employees in the United States are offered the opportunity
to participate in the 401K pension plan, which involves
no contribution or obligation from the Group besides
withholding and paying the employee contribution.
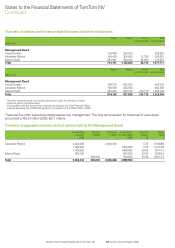
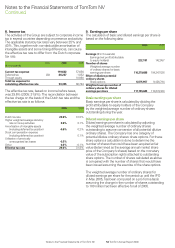
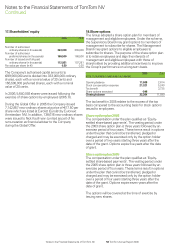
Remuneration policy for members of the
Management Board and the Supervisory Board
Remuneration of members of the Management Board
is drawn up and approved by the Supervisory Board.
In accordance with the Dutch Corporate Governance
Code as issued on 9 December 2003, the remuneration
of Supervisory Board members does not depend on
the results of the Company. The Company does not
grant either stock options or shares to its Supervisory
Board members and the Company does not provide
loans to them.
The total remuneration paid to or on behalf of members of
the Management Board in the year ended 31 December
2006 amounted to approximately 2.0 million (2005: 2.2
million), of which approximately 60% represented bonus
payments (2005: 37%). The maximum bonus is calculated
as 1% of profit before tax and is shared equally across all
members of the Senior Management Team including the
members of the Management Board provided that certain
financial and personal targets are met. The financial targets
make up 90% of the bonus and the operational targets
make up 10% of the bonus.