TomTom 2006 Annual Report Download - page 56
Download and view the complete annual report
Please find page 56 of the 2006 TomTom annual report below. You can navigate through the pages in the report by either clicking on the pages listed below, or by using the keyword search tool below to find specific information within the annual report.-
 1
1 -
2
-
3
-
4
-
5
-
6
-
7
-
8
-
9
-
10
-
11
-
12
-
13
-
14
-
15
-
16
-
17
-
18
-
19
-
20
-
21
-
22
-
23
-
24
-
25
-
26
-
27
-
28
-
29
-
30
-
31
-
32
-
33
-
34
-
35
-
36
-
37
-
38
-
39
-
40
-
41
-
42
-
43
-
44
-
45
-
 46
46 -
 47
47 -
 48
48 -
 49
49 -
 50
50 -
 51
51 -
 52
52 -
 53
53 -
 54
54 -
 55
55 -
 56
56 -
 57
57 -
 58
58 -
 59
59 -
 60
60 -
 61
61 -
 62
62 -
 63
63 -
 64
64 -
 65
65 -
 66
66 -
67
-
68
-
69
-
70
-
71
-
72
-
73
 |
 |

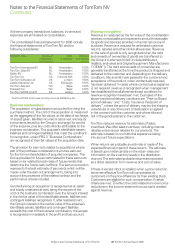
54 TomTom Annual Report 2006Notes to the Financial Statements of TomTom NV
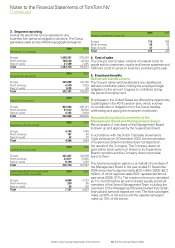
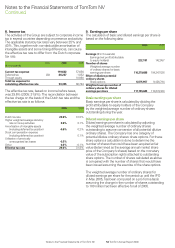
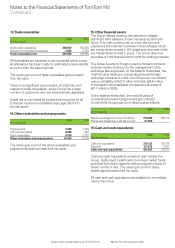
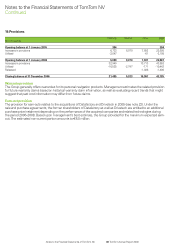
8. Income tax
The activities of the Group are subject to corporate income
tax in several countries depending on presence and activity.
The applicable statutory tax rates vary between 25% and
40%. This, together with non-deductible amortisation of
intangible assets and some timing differences, can cause
the effective tax rate to differ from the Dutch corporate
tax rate.
Note 2006 2005
(in thousands)
Current tax expense 119,622 57,656
Deferred tax (20) -26,267 -1,852
Through equity 10,980
Total tax expense for
calculating effective tax rate 93,355 66,784
The effective tax rate, based on income before taxes,
was 29.6% (2005: 31.8%). The reconciliation between
the tax charge on the basis of the Dutch tax rate and the
effective tax rate is as follows:
2006 2005
Dutch tax rate 29.6% 31.5%
Higher weighted average statutory
rate on Group activities 0.6% 0.1%
Amortisation of intangible assets
(including deferred tax position) -0.6% 0.2%
Stock compensation expense
(including deferred tax position) 0.1%
Utilisation of previously
unrecognised tax losses -0.2%
Other 0.2% -0.1%
Effective tax rate 29.6% 31.8%
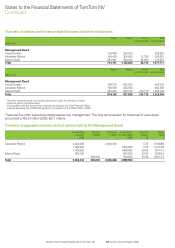
9. Earnings per share
The calculation of basic and diluted earnings per share is
based on the following data:
2006 2005
Earnings (in thousands)
Earnings (net profit attributable
to equity holders) 222,181 142,957
Number of shares
Weighted average number
of ordinary shares for basic
earnings per share 110,279,686 104,247,526
Effect of dilutive potential
ordinary shares
Share options 6,875,957 9,426,794
Weighted average number of
ordinary shares for diluted
earnings per share 117,155,643 113,674,320
Basic earnings per share
Basic earnings per share is calculated by dividing the
profit attributable to equity holders of the Company
by the weighted average number of ordinary shares
outstanding during the year.
Diluted earnings per share
Diluted earnings per share is calculated by adjusting
the weighted average number of ordinary shares
outstanding to assume conversion of all potential dilutive
ordinary shares. The Company has one category of
potential dilutive ordinary shares: share options. For these
share options a calculation is done to determine the
number of shares that could have been acquired at fair
value (determined as the average annual market share
price of the Company’s shares) based on the monetary
value of the subscription rights attached to outstanding
share options. The number of shares calculated as above
is compared with the number of shares that would have
been issued assuming the exercise of the share options.
The weighted average number of ordinary shares for
diluted earnings per share for the period up until the IPO
in May 2005, has been computed on a pro forma basis
assuming the change in the number of shares outstanding
to 100 million had been effective for all of 2005.
Notes to the Financial Statements of TomTom NV
Continued