Snapple 2011 Annual Report Download - page 3
Download and view the complete annual report
Please find page 3 of the 2011 Snapple annual report below. You can navigate through the pages in the report by either clicking on the pages listed below, or by using the keyword search tool below to find specific information within the annual report.-
 1
1 -
 2
2 -
 3
3 -
 4
4 -
 5
5 -
 6
6 -
 7
7 -
 8
8 -
 9
9 -
 10
10 -
 11
11 -
 12
12 -
 13
13 -
 14
14 -
15
-
16
-
17
-
18
-
19
-
20
-
21
-
22
-
23
-
24
-
25
-
26
-
27
-
28
-
29
-
30
-
31
-
32
-
33
-
34
-
35
-
36
-
37
-
38
-
39
-
40
-
41
-
42
-
43
-
44
-
45
-
46
-
47
-
48
-
49
-
50
-
51
-
52
-
53
-
54
-
55
-
56
-
57
-
58
-
59
-
60
-
61
-
62
-
63
-
64
-
65
-
66
-
67
-
68
-
69
-
70
-
71
-
72
-
73
-
74
-
75
-
76
-
77
-
78
-
79
-
80
-
81
-
82
-
83
-
84
-
85
-
86
-
87
-
88
-
89
-
90
-
91
-
92
-
93
-
94
-
95
-
96
-
97
-
98
-
99
-
100
-
101
-
102
-
103
-
104
-
105
-
106
-
107
-
108
-
109
-
110
-
111
-
112
-
113
-
114
-
115
-
116
-
117
-
118
-
119
-
120
-
121
-
122
-
123
-
124
-
125
-
126
-
127
-
128
-
129
-
130
-
131
-
132
-
133
-
134
-
135
-
136
-
137
-
138
-
139
-
140
 |
 |

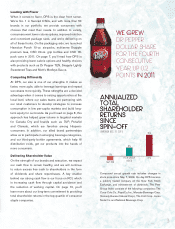
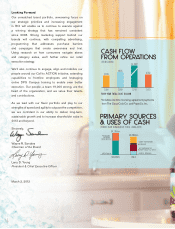
In 2011, despite challenging macroeconomic conditions,
including some of the highest commodity infl ation in years
and ongoing economic pressures, our brands continued
to perform well. We grew net sales 5 percent, and our
cash fl ow remained strong and consistent, enabling us
to return approximately $773 million to shareholders last
year, with $522 million in share repurchases and $251
million in dividends.
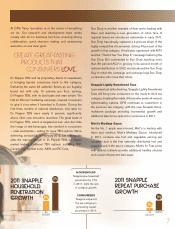
During the year, we increased our all-commodity volume
(ACV) distribution, getting more of our products into a
higher percentage of retailers and gaining additional
shelf space. We increased ACV on our core brands
and packages in grocery by 8 percentage points for
carbonated soft drinks (CSDs) and 2 percentage points
for Snapple and Mott’s.
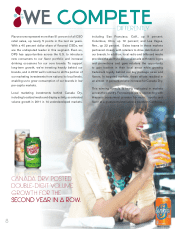
We also continued to grow per-capita consumption
in targeted markets for Snapple, up 1.2 servings per
person, and Canada Dry, up 0.3 servings. In addition,
11 of our 14 leading brands continue to hold the No. 1
position in their fl avor category.
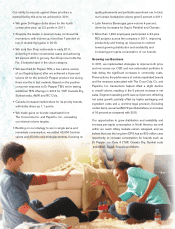
Our priorities remain clear and unchanged: building our
brands, growing per-capita consumption, and creating
a strong business foundation underpinned by rapid
continuous improvement (RCI).
*2011 diluted earnings per share (EPS) excludes a legal reserve,
which totaled 5 cents per share. 2010 diluted EPS excludes
a loss on early extinguishment of debt and certain tax-related
items, which totaled 23 cents per share. See page 13 for a
detailed reconciliation of the excluded items and the rationale for
the exclusion.
PRESIDENT & CEO
LARRY D. YOUNG
CHAIRMAN OF THE BOARD
WAYNE R. SANDERS
1
To Our Stockholders:
WINNERS LEAD,
COMPETE AND DELIVER.
THEY ALSO REPEAT.
LETTER TO
STOCKHOLDERS
2011 FINANCIAL SNAPSHOT
(MILLIONS, EXCEPT EARNINGS PER SHARE)
NET
SALES
SEGMENT
O
PERATING
PROFIT
DILUTED
EARNINGS
PER SHARE*
2011 $5,903
2010 $5,636
2011 $1,341
2010 $1,321
2011 $2.79
2010 $2.40
+5%
+2%
+16%