Sharp 2010 Annual Report Download - page 56
Download and view the complete annual report
Please find page 56 of the 2010 Sharp annual report below. You can navigate through the pages in the report by either clicking on the pages listed below, or by using the keyword search tool below to find specific information within the annual report.-
 1
1 -
2
-
3
-
4
-
5
-
6
-
7
-
8
-
9
-
10
-
11
-
12
-
13
-
14
-
15
-
16
-
17
-
18
-
19
-
20
-
21
-
22
-
23
-
24
-
25
-
26
-
27
-
28
-
29
-
30
-
31
-
32
-
33
-
34
-
35
-
36
-
37
-
38
-
39
-
40
-
41
-
42
-
43
-
44
-
45
-
 46
46 -
 47
47 -
 48
48 -
 49
49 -
 50
50 -
 51
51 -
 52
52 -
 53
53 -
 54
54 -
 55
55 -
 56
56 -
 57
57 -
 58
58 -
 59
59 -
 60
60 -
 61
61 -
 62
62 -
 63
63 -
 64
64 -
 65
65 -
 66
66 -
67
-
68
 |
 |

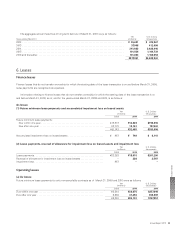
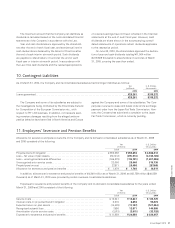
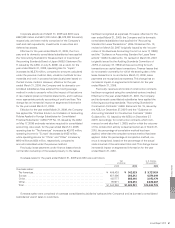
(b) As lessor
Future minimum lease receipts for only non-cancelable contracts as of March 31, 2009 and 2010 were as follows:
Yen
(millions)
U.S. Dollars
(thousands)
2009 2010 2010
Due within one year . . . . . . . . . . . . . . . . . . . . . . . . . . . . . . . . . . . . . . . . . . . . . . . . ¥ 699 ¥ 831 $ 9,033
Due after one year . . . . . . . . . . . . . . . . . . . . . . . . . . . . . . . . . . . . . . . . . . . . . . . . . 1,341 1,641 17,837
¥2,040 ¥2,472 $26,870
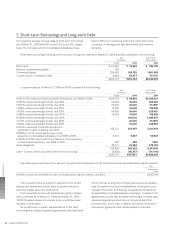
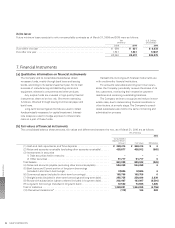
7. Financial Instruments
(a) Qualitative information on financial instruments
The Company and its consolidated subsidiaries obtain
necessary funds, mainly through bank loans and issuing
bonds, according to its capital investment plan, for its main
business of manufacturing and distributing electronics
equipment, electronic components and other products.
Any surplus funds are invested in high quality financial
instruments, deem to be low risk. Short-term operating
funds are obtained through issuing commercial paper and
bank loans.
Long-term borrowings and bonds are used to obtain
funds principally necessary for capital investment. Interest-
rate swaps are used to hedge exposure to interest rate
risks on a part of these funds.
Transactions involving such financial instruments are
with creditworthy financial institutions.
For accounts receivables and long-term loan receiv-
ables, the Company periodically reviews the status of its
key customers, monitoring their respective payment
deadlines and remaining outstanding balances.
The Company strives to recognize and reduce irrecov-
erable risks, due to deteriorating financial conditions or
other factors, at an early stage. The Company’s consoli-
dated subsidiaries also follow the same monitoring and
administration process.
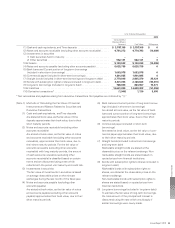
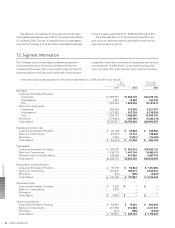
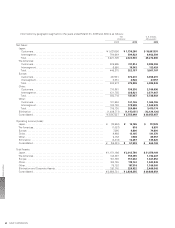
(b) Fair values of financial instruments
The consolidated balance sheet amounts, fair values and differences between the two, as of March 31, 2010 are as follows:
Yen (millions)
2010
Consolidated
Balance Sheet
Amount Fair Value Difference
(1) Cash and cash equivalents, and Time deposits . . . . . . . . . . . . . . . . . . . . . . . ¥ 348,414 ¥ 348,414 ¥ 0
(2) Notes and accounts receivable (excluding other accounts receivable). . . . . . 439,877 438,912 (965)
(3) Investments in securities
1) Debt securities held to maturity . . . . . . . . . . . . . . . . . . . . . . . . . . . . . . . . . – – –
2) Other securities . . . . . . . . . . . . . . . . . . . . . . . . . . . . . . . . . . . . . . . . . . . . . 51,717 51,717 0
Total Assets . . . . . . . . . . . . . . . . . . . . . . . . . . . . . . . . . . . . . . . . . . . . . . . . . . . . . 840,008 839,043 (965)
(4) Notes and accounts payable (excluding other accounts payable) . . . . . . . . . . 554,368 554,368 0
(5) Bank loans and Current portion of long-term borrowings
(included in short-term borrowings) . . . . . . . . . . . . . . . . . . . . . . . . . . . . . . . .
97,886
97,886
0
(6) Commercial paper (included in short-term borrowings) . . . . . . . . . . . . . . . . . 165,755 165,755 0
(7) Straight bonds (included in short-term borrowings and long-term debt). . . . . . 255,755 258,094 2,339
(8) Bonds with subscription rights to shares (included in long-term debt). . . . . . 202,497 193,997 (8,500)
(9) Long-term borrowings (included in long-term debt) . . . . . . . . . . . . . . . . . . . . 72,560 73,965 1,405
Total of Liabilities . . . . . . . . . . . . . . . . . . . . . . . . . . . . . . . . . . . . . . . . . . . . . . . . . 1,348,821 1,344,065 (4,756)
(10) Derivative transactions* . . . . . . . . . . . . . . . . . . . . . . . . . . . . . . . . . . . . . . . . (179) 104 283
Financial Section
SHARP CORPORATION54