Sharp 2010 Annual Report Download - page 53
Download and view the complete annual report
Please find page 53 of the 2010 Sharp annual report below. You can navigate through the pages in the report by either clicking on the pages listed below, or by using the keyword search tool below to find specific information within the annual report.-
 1
1 -
2
-
3
-
4
-
5
-
6
-
7
-
8
-
9
-
10
-
11
-
12
-
13
-
14
-
15
-
16
-
17
-
18
-
19
-
20
-
21
-
22
-
23
-
24
-
25
-
26
-
27
-
28
-
29
-
30
-
31
-
32
-
33
-
34
-
35
-
36
-
37
-
38
-
39
-
40
-
41
-
42
-
 43
43 -
 44
44 -
 45
45 -
 46
46 -
 47
47 -
 48
48 -
 49
49 -
 50
50 -
 51
51 -
 52
52 -
 53
53 -
 54
54 -
 55
55 -
 56
56 -
 57
57 -
 58
58 -
 59
59 -
 60
60 -
 61
61 -
 62
62 -
 63
63 -
64
-
65
-
66
-
67
-
68
 |
 |

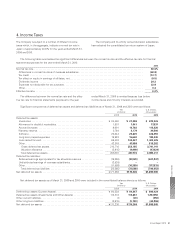
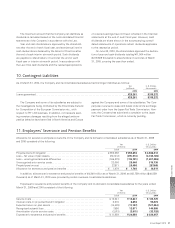
4. Income Taxes
The Company is subject to a number of different income
taxes which, in the aggregate, indicate a normal tax rate in
Japan of approximately 40.6% for the years ended March 31,
2009 and 2010.
The following table summarizes the significant differences between the normal tax rate and the effective tax rate for financial
statements purposes for the year ended March 31, 2010:
2010
Normal tax rate. . . . . . . . . . . . . . . . . . . . . . . . . . . . . . . . . . . . . . . . . . . . . . . . . . . . . . . . . . . . . . . . . . . . . . . . . . . . . . . . . 40.6%
Differences in normal tax rates of overseas subsidiaries . . . . . . . . . . . . . . . . . . . . . . . . . . . . . . . . . . . . . . . . . . . . . . . (69.8)
Tax credit . . . . . . . . . . . . . . . . . . . . . . . . . . . . . . . . . . . . . . . . . . . . . . . . . . . . . . . . . . . . . . . . . . . . . . . . . . . . . . . . . . . (13.7)
Tax effect on equity in earnings of affiliates, net . . . . . . . . . . . . . . . . . . . . . . . . . . . . . . . . . . . . . . . . . . . . . . . . . . . . . . (8.5)
Dividends income . . . . . . . . . . . . . . . . . . . . . . . . . . . . . . . . . . . . . . . . . . . . . . . . . . . . . . . . . . . . . . . . . . . . . . . . . . . . 24.2
Expenses not deductible for tax purposes . . . . . . . . . . . . . . . . . . . . . . . . . . . . . . . . . . . . . . . . . . . . . . . . . . . . . . . . . . 23.8
Other. . . . . . . . . . . . . . . . . . . . . . . . . . . . . . . . . . . . . . . . . . . . . . . . . . . . . . . . . . . . . . . . . . . . . . . . . . . . . . . . . . . . . . . 3.4
Effective tax rate. . . . . . . . . . . . . . . . . . . . . . . . . . . . . . . . . . . . . . . . . . . . . . . . . . . . . . . . . . . . . . . . . . . . . . . . . . . . . . . . 0.0%
The difference between the normal tax rate and the effec-
tive tax rate for financial statements purposes for the year
ended March 31, 2009 is omitted because loss before
income taxes and minority interests is recorded.
Significant components of deferred tax assets and deferred tax liabilities as of March 31, 2009 and 2010 were as follows:
Yen
(millions)
U.S. Dollars
(thousands)
2009 2010 2010
Deferred tax assets:
Inventories . . . . . . . . . . . . . . . . . . . . . . . . . . . . . . . . . . . . . . . . . . . . . . . . . . . . . ¥ 24,460 ¥ 21,098 $ 229,326
Allowance for doubtful receivables . . . . . . . . . . . . . . . . . . . . . . . . . . . . . . . . . . . 1,907 1,641 17,837
Accrued bonuses . . . . . . . . . . . . . . . . . . . . . . . . . . . . . . . . . . . . . . . . . . . . . . . . 9,691 10,702 116,326
Warranty reserve. . . . . . . . . . . . . . . . . . . . . . . . . . . . . . . . . . . . . . . . . . . . . . . . . 2,764 3,174 34,500
Software . . . . . . . . . . . . . . . . . . . . . . . . . . . . . . . . . . . . . . . . . . . . . . . . . . . . . . . 25,644 20,825 226,359
Long-term prepaid expenses . . . . . . . . . . . . . . . . . . . . . . . . . . . . . . . . . . . . . . . 16,928 16,600 180,435
Loss carried forward . . . . . . . . . . . . . . . . . . . . . . . . . . . . . . . . . . . . . . . . . . . . . . 86,403 130,647 1,420,076
Other. . . . . . . . . . . . . . . . . . . . . . . . . . . . . . . . . . . . . . . . . . . . . . . . . . . . . . . . . . 42,919 47,498 516,282
Gross deferred tax assets . . . . . . . . . . . . . . . . . . . . . . . . . . . . . . . . . . . . . . . . 210,716 252,185 2,741,141
Valuation allowance . . . . . . . . . . . . . . . . . . . . . . . . . . . . . . . . . . . . . . . . . . . . . (3,915) (4,409) (47,924)
Total deferred tax assets . . . . . . . . . . . . . . . . . . . . . . . . . . . . . . . . . . . . . . . . . 206,801 247,776 2,693,217
Deferred tax liabilities:
Retained earnings appropriated for tax allowable reserves . . . . . . . . . . . . . . . . (19,858) (57,209) (621,837)
Undistributed earnings of overseas subsidiaries. . . . . . . . . . . . . . . . . . . . . . . . . (3,838) – –
Other. . . . . . . . . . . . . . . . . . . . . . . . . . . . . . . . . . . . . . . . . . . . . . . . . . . . . . . . . . (11,869) (16,359) (177,815)
Total deferred tax liabilities . . . . . . . . . . . . . . . . . . . . . . . . . . . . . . . . . . . . . . . (35,565) (73,568) (799,652)
Net deferred tax assets . . . . . . . . . . . . . . . . . . . . . . . . . . . . . . . . . . . . . . . . . . . . . ¥171,236 ¥174,208 $1,893,565
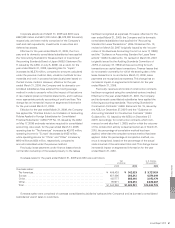
Net deferred tax assets as of March 31, 2009 and 2010 were included in the consolidated balance sheets as follows:
Yen
(millions)
U.S. Dollars
(thousands)
2009 2010 2010
Deferred tax assets (Current Assets) . . . . . . . . . . . . . . . . . . . . . . . . . . . . . . . . . . . ¥ 60,538 ¥ 64,347 $ 699,424
Deferred tax assets (Investments and Other Assets). . . . . . . . . . . . . . . . . . . . . . . 113,314 115,667 1,257,250
Other current liabilities . . . . . . . . . . . . . . . . . . . . . . . . . . . . . . . . . . . . . . . . . . . . . . (1) (23) (250)
Other long-term liabilities . . . . . . . . . . . . . . . . . . . . . . . . . . . . . . . . . . . . . . . . . . . . (2,615) (5,783) (62,859)
Net deferred tax assets . . . . . . . . . . . . . . . . . . . . . . . . . . . . . . . . . . . . . . . . . . . . . ¥171,236 ¥174,208 $1,893,565
The Company and its wholly owned domestic subsidiaries
have adopted the consolidated tax return system of Japan.
Financial Section
Annual Report 2010 51