Sharp 2010 Annual Report Download - page 45
Download and view the complete annual report
Please find page 45 of the 2010 Sharp annual report below. You can navigate through the pages in the report by either clicking on the pages listed below, or by using the keyword search tool below to find specific information within the annual report.-
 1
1 -
2
-
3
-
4
-
5
-
6
-
7
-
8
-
9
-
10
-
11
-
12
-
13
-
14
-
15
-
16
-
17
-
18
-
19
-
20
-
21
-
22
-
23
-
24
-
25
-
26
-
27
-
28
-
29
-
30
-
31
-
32
-
33
-
34
-
 35
35 -
 36
36 -
 37
37 -
 38
38 -
 39
39 -
 40
40 -
 41
41 -
 42
42 -
 43
43 -
 44
44 -
 45
45 -
 46
46 -
 47
47 -
 48
48 -
 49
49 -
 50
50 -
 51
51 -
 52
52 -
 53
53 -
 54
54 -
 55
55 -
56
-
57
-
58
-
59
-
60
-
61
-
62
-
63
-
64
-
65
-
66
-
67
-
68
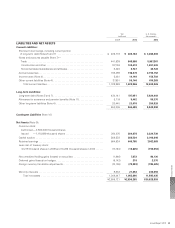
 |
 |

Yen
(millions)
U.S. Dollars
(thousands)
2009 2010 2010
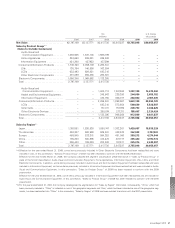
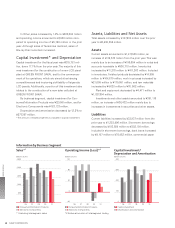
LIABILITIES AND NET ASSETS
Current Liabilities:
Short-term borrowings, including current portion
of long-term debt (Notes 5 and 7) . . . . . . . . . . . . . . . . . . . . . . . . . . . . . . . . . . ¥ 405,773 ¥ 302,184 $ 3,284,609
Notes and accounts payable (Note 7)—
Trade . . . . . . . . . . . . . . . . . . . . . . . . . . . . . . . . . . . . . . . . . . . . . . . . . . . . . . . . 441,939 548,988 5,967,261
Construction and other . . . . . . . . . . . . . . . . . . . . . . . . . . . . . . . . . . . . . . . . . . 107,126 100,418 1,091,500
Nonconsolidated subsidiaries and affiliates. . . . . . . . . . . . . . . . . . . . . . . . . . . 3,420 3,747 40,728
Accrued expenses. . . . . . . . . . . . . . . . . . . . . . . . . . . . . . . . . . . . . . . . . . . . . . . . 188,299 198,274 2,155,152
Income taxes (Note 4). . . . . . . . . . . . . . . . . . . . . . . . . . . . . . . . . . . . . . . . . . . . . 5,461 14,149 153,793
Other current liabilities (Note 4) . . . . . . . . . . . . . . . . . . . . . . . . . . . . . . . . . . . . . 37,951 56,146 610,283
Total current liabilities. . . . . . . . . . . . . . . . . . . . . . . . . . . . . . . . . . . . . . . . . . 1,189,969 1,223,906 13,303,326
Long-term Liabilities:
Long-term debt (Notes 5 and 7) . . . . . . . . . . . . . . . . . . . . . . . . . . . . . . . . . . . . . 424,141 517,951 5,629,902
Allowance for severance and pension benefits (Note 11) . . . . . . . . . . . . . . . . . . 5,719 5,462 59,370
Other long-term liabilities (Note 4) . . . . . . . . . . . . . . . . . . . . . . . . . . . . . . . . . . . 20,445 23,076 250,826
450,305 546,489 5,940,098
Contingent Liabilities (Note 10)
Net Assets (Note 9):
Common stock:
Authorized —2,500,000 thousand shares
Issued —1,110,699 thousand shares . . . . . . . . . . . . . . . . . . . . . . . . . . . . 204,676 204,676 2,224,739
Capital surplus . . . . . . . . . . . . . . . . . . . . . . . . . . . . . . . . . . . . . . . . . . . . . . . . . . 268,538 268,534 2,918,848
Retained earnings . . . . . . . . . . . . . . . . . . . . . . . . . . . . . . . . . . . . . . . . . . . . . . . . 664,924 649,795 7,062,989
Less cost of treasury stock:
10,219 thousand shares in 2009 and 10,285 thousand shares in 2010 . . . . . . (13,740) (13,805) (150,054)
Net unrealized holding gains (losses) on securities . . . . . . . . . . . . . . . . . . . . . . (1,946) 7,372 80,130
Deferred gains (losses) on hedges . . . . . . . . . . . . . . . . . . . . . . . . . . . . . . . . . . . (9,142) 218 2,370
Foreign currency translation adjustments . . . . . . . . . . . . . . . . . . . . . . . . . . . . . . (74,196) (72,283) (785,685)
Minority interests . . . . . . . . . . . . . . . . . . . . . . . . . . . . . . . . . . . . . . . . . . . . . . . . 9,333 21,353 232,098
Total net assets . . . . . . . . . . . . . . . . . . . . . . . . . . . . . . . . . . . . . . . . . . . . . . 1,048,447 1,065,860 11,585,435
¥2,688,721 ¥2,836,255 $30,828,859
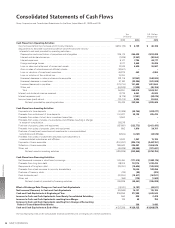
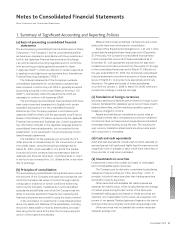
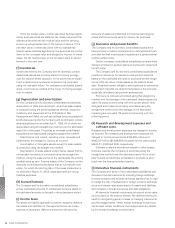
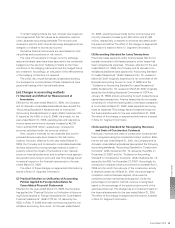
Financial Section
Annual Report 2010 43