Sharp 2010 Annual Report Download - page 52
Download and view the complete annual report
Please find page 52 of the 2010 Sharp annual report below. You can navigate through the pages in the report by either clicking on the pages listed below, or by using the keyword search tool below to find specific information within the annual report.-
 1
1 -
2
-
3
-
4
-
5
-
6
-
7
-
8
-
9
-
10
-
11
-
12
-
13
-
14
-
15
-
16
-
17
-
18
-
19
-
20
-
21
-
22
-
23
-
24
-
25
-
26
-
27
-
28
-
29
-
30
-
31
-
32
-
33
-
34
-
35
-
36
-
37
-
38
-
39
-
40
-
41
-
 42
42 -
 43
43 -
 44
44 -
 45
45 -
 46
46 -
 47
47 -
 48
48 -
 49
49 -
 50
50 -
 51
51 -
 52
52 -
 53
53 -
 54
54 -
 55
55 -
 56
56 -
 57
57 -
 58
58 -
 59
59 -
 60
60 -
 61
61 -
 62
62 -
63
-
64
-
65
-
66
-
67
-
68
 |
 |

(5) Accounting Standard for Pension Benefits
Effective for the year ended March 31, 2010, the Company
and its domestic consolidated subsidiaries have applied the
“Partial Amendments to Accounting Standard for Retirement
Benefits (Part 3)” (ASBJ Statement No. 19, issued by the
ASBJ on July 31, 2008). This change has no impact on the
financial statements for the year ended March 31, 2010.
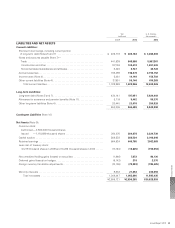
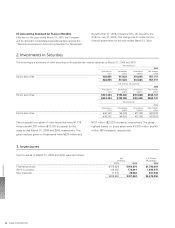
2. Investments in Securities
The following is a summary of other securities with available fair market values as of March 31, 2009 and 2010:
Yen (millions)
2010
Acquisition
cost
Unrealized
gains
Unrealized
losses
Fair market
value
Equity securities . . . . . . . . . . . . . . . . . . . . . . . . . . . . . . . . . . . . . . . . . . . . . . ¥38,955 ¥17,423 ¥(4,661) ¥51,717
¥38,955 ¥17,423 ¥(4,661) ¥51,717
U.S. Dollars (thousands)
2010
Acquisition
cost
Unrealized
gains
Unrealized
losses
Fair market
value
Equity securities . . . . . . . . . . . . . . . . . . . . . . . . . . . . . . . . . . . . . . . . . . . . . . $423,424 $189,380 $(50,663) $562,141
$423,424 $189,380 $(50,663) $562,141
Yen (millions)
2009
Acquisition
cost
Unrealized
gains
Unrealized
losses
Fair market
value
Equity securities . . . . . . . . . . . . . . . . . . . . . . . . . . . . . . . . . . . . . . . . . . . . . . ¥40,142 ¥4,003 ¥(7,142) ¥37,003
¥40,142 ¥4,003 ¥(7,142) ¥37,003
The proceeds from sales of other securities were ¥1,715
million and ¥1,207 million ($13,120 thousand) for the
years ended March 31, 2009 and 2010, respectively. The
gross realized gains on those sales were ¥224 million and
¥187 million ($2,033 thousand), respectively. The gross
realized losses on those sales were ¥1,915 million and ¥0
million ($0 thousand), respectively.
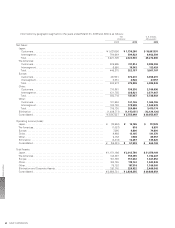
3. Inventories
Inventories as of March 31, 2009 and 2010 were as follows:
Yen
(millions)
U.S. Dollars
(thousands)
2009 2010 2010
Finished products . . . . . . . . . . . . . . . . . . . . . . . . . . . . . . . . . . . . . . . . . . . . . . . . . . ¥179,629 ¥164,670 $1,789,891
Work in process . . . . . . . . . . . . . . . . . . . . . . . . . . . . . . . . . . . . . . . . . . . . . . . . . . . 148,482 170,091 1,848,815
Raw materials. . . . . . . . . . . . . . . . . . . . . . . . . . . . . . . . . . . . . . . . . . . . . . . . . . . . . 71,874 76,502 831,544
¥399,985 ¥411,263 $4,470,250
Financial Section
SHARP CORPORATION50