Sharp 2010 Annual Report Download - page 41
Download and view the complete annual report
Please find page 41 of the 2010 Sharp annual report below. You can navigate through the pages in the report by either clicking on the pages listed below, or by using the keyword search tool below to find specific information within the annual report.-
 1
1 -
2
-
3
-
4
-
5
-
6
-
7
-
8
-
9
-
10
-
11
-
12
-
13
-
14
-
15
-
16
-
17
-
18
-
19
-
20
-
21
-
22
-
23
-
24
-
25
-
26
-
27
-
28
-
29
-
30
-
 31
31 -
 32
32 -
 33
33 -
 34
34 -
 35
35 -
 36
36 -
 37
37 -
 38
38 -
 39
39 -
 40
40 -
 41
41 -
 42
42 -
 43
43 -
 44
44 -
 45
45 -
 46
46 -
 47
47 -
 48
48 -
 49
49 -
 50
50 -
 51
51 -
52
-
53
-
54
-
55
-
56
-
57
-
58
-
59
-
60
-
61
-
62
-
63
-
64
-
65
-
66
-
67
-
68
 |
 |
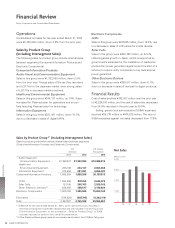
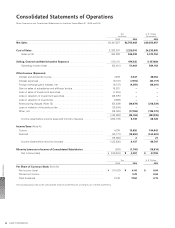
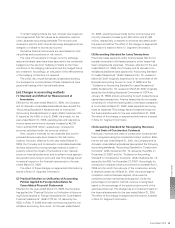
to 17.2%. SG&A expenses include advertising expenses
of ¥50,246 million, and employees’ salaries and other
benefits expenses of ¥113,517 million.
As a result, operating income amounted to ¥51,903
million compared to an operating loss of ¥55,481 million in
the prior year.
Other expenses, net of other income, were in a net
loss position and amounted to ¥45,764 million.
Income before income taxes and minority interests
amounted to ¥6,139 million compared to a loss before
income taxes and minority interests of ¥204,139 million in
the prior year. Net income for the year was ¥4,397 million
compared to a net loss of ¥125,815 million in the prior
year. Net income per share of common stock was ¥4.00.
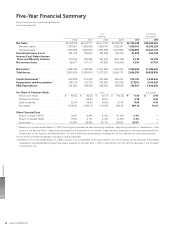
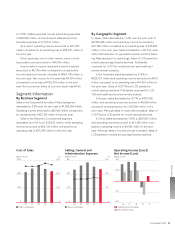
Segment Information
By Business Segment
Sales in the Consumer/Information Products segment
decreased by 2.5% over the prior year to ¥1,858,208 million.
Operating income amounted to ¥33,983 million compared to
an operating loss of ¥33,769 million in the prior year.
Sales in the Electronic Components segment
decreased by 8.9% to ¥1,385,535 million, while operating
income amounted to ¥20,134 million compared to an
operating loss of ¥23,975 million in the prior year.
By Geographic Segment
In Japan, sales decreased by 4.0% over the prior year to
¥2,324,903 million and operating income amounted to
¥10,785 million compared to an operating loss of ¥74,552
million in the prior year. Sales increased for LCD TVs, solar
cells, Plasmacluster Ion generators and air purifiers featur-
ing Plasmacluster Ion technology. Sales of LCD panels for
mobile devices significantly declined. Profitability
improved for LCD TVs, mobile phones and health and
environmental products.
In the Americas, sales decreased by 27.8% to
¥322,157 million and operating income amounted to ¥818
million compared to an operating loss of ¥1,057 million in
the prior year. Sales of LCD TVs and LCD panels for
mobile devices declined. Profitability improved for LCD
TVs and health and environmental products.
In Europe, sales decreased by 12.7% to ¥375,898
million and operating income amounted to ¥6,890 million
compared to operating income of ¥7,395 million in the
prior year. Although sales of solar cells increased, sales of
LCD TVs and LCD panels for mobile devices declined.
In China, sales decreased by 17.9% to ¥527,957 million
and operating income amounted to ¥12,105 million com-
pared to operating income of ¥9,988 million in the prior
year. Although sales of mobile phones increased, sales of
LCD panels for mobile devices significantly declined.
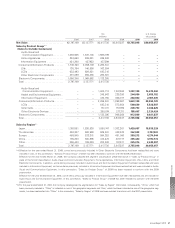
Cost of Sales
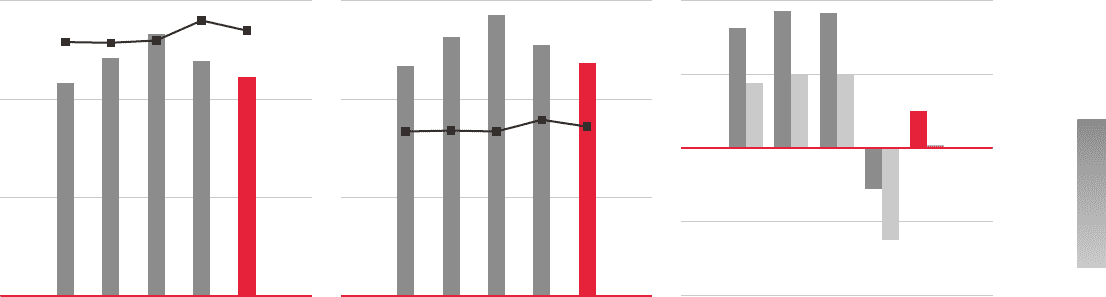
(billions of yen) (%)
Operating Income (Loss)/
Net Income (Loss)
(billions of yen)
Selling, General and
Administrative Expenses
(billions of yen) (%)
3,000 90.0
00
08 09 100706
2,000 60.0
1,000 30.0
600 30.0
00
08 09 100706
400 20.0
200 10.0
200
–200
08 09 100706
100
0
–100
nn Operating income (loss)
nn Net income (loss)
n Ratio to net sales n Ratio to net sales
Financial Section
Annual Report 2010 39