Ricoh 2009 Annual Report Download - page 9
Download and view the complete annual report
Please find page 9 of the 2009 Ricoh annual report below. You can navigate through the pages in the report by either clicking on the pages listed below, or by using the keyword search tool below to find specific information within the annual report.-
 1
1 -
 2
2 -
 3
3 -
 4
4 -
 5
5 -
 6
6 -
 7
7 -
 8
8 -
 9
9 -
 10
10 -
 11
11 -
 12
12 -
 13
13 -
 14
14 -
 15
15 -
 16
16 -
 17
17 -
 18
18 -
 19
19 -
 20
20 -
21
-
22
-
23
-
24
-
25
-
26
-
27
-
28
-
29
-
30
-
31
-
32
-
33
-
34
-
35
-
36
-
37
-
38
-
39
-
40
-
41
-
42
-
43
-
44
-
45
-
46
-
47
-
48
-
49
-
50
-
51
-
52
-
53
-
54
-
55
-
56
-
57
-
58
-
59
-
60
-
61
-
62
-
63
-
64
-
65
-
66
-
67
-
68
-
69
-
70
-
71
-
72
-
73
-
74
-
75
-
76
-
77
-
78
-
79
-
80
-
81
-
82
 |
 |

ANNUAL REPORT 2009 8
R e v i e w o f O p e r a t i o n s
To Our Shareholders
and Customers
Fiscal 2009
Highlights
Progress of the
16th MTP
Creating New
Customer Value
RICOH
Milestones
Sustainable Environ-
mental Management
Corporate Social
Responsibility
Financial
Section
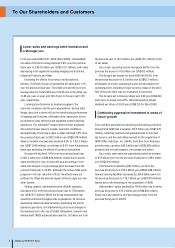
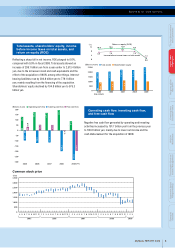
Refl ecting a sharp fall in net income, ROE plunged to 0.6%,
compared with 9.9% in fi scal 2008. Total assets showed an
increase of 299.1 billion yen from a year earlier to 2,513.4 billion
yen, due to the increase in cash and cash equivalents and the
effect of the acquisition of IKON, among other things. Interest-
bearing liabilities rose by 394.8 billion yen to 779.1 billion
yen, mainly resulting from the fi nancing of the acquisition.
Shareholders’ equity declined by 104.8 billion yen to 975.3
billion yen.
(%)
10.0
6.9
10.6
7.6
11.0
0.6
8.1
1.3
2,500
2,000
1,500
1,000
500
02005
(End of March)
1,953.6
862.9
2006
2,041.1
960.2
2007
2,243.4
1,070.9
2009
2,513.4
975.3
2008
2,214.3
1,080.1
0
4
8
12 9.9
7.8
Return on equity (ROE)
Income before income taxes on total assets
(Billions of yen) Total assets Shareholders’ equity
AB
AB
2005
129.1
33.0
-96.0
200
150
100
50
0
-50
-100
-150
-200
-250
-300
2006
173.4
53.4
-120.0
2007
167.2
51.8
-115.4
2009
87.4
-195.6
-283.1
2008
194.3
-3.9
-198.3
(Billions of yen) Operating cash flow Investing cash flow Free cash flow
ABC
A
B
C
(FY)
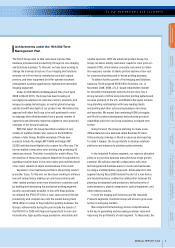
Negative free cash fl ow generated by operating and investing
activities increased by 191.7 billion yen from the previous year
to 195.6 billion yen, mainly due to lower net income and the
cash disbursement for the acquisition of IKON.
2005 2006
4 1 2 3 4 5 6 7 8 95 6 7 8 9
10 11 12 10 11 12
2007
123456789
10 11 12
2008 2009
123 123456789
10 11 12
(Yen)
3,500
3,000
2,500
2,000
1,500
1,000
500
0
Total assets, shareholders’ equity, income
before income taxes on total assets, and
return on equity (ROE)
Operating cash flow, investing cash flow,
and free cash flow
Common stock price