Ricoh 2009 Annual Report Download - page 4
Download and view the complete annual report
Please find page 4 of the 2009 Ricoh annual report below. You can navigate through the pages in the report by either clicking on the pages listed below, or by using the keyword search tool below to find specific information within the annual report.-
 1
1 -
 2
2 -
 3
3 -
 4
4 -
 5
5 -
 6
6 -
 7
7 -
 8
8 -
 9
9 -
 10
10 -
 11
11 -
 12
12 -
 13
13 -
 14
14 -
 15
15 -
16
-
17
-
18
-
19
-
20
-
21
-
22
-
23
-
24
-
25
-
26
-
27
-
28
-
29
-
30
-
31
-
32
-
33
-
34
-
35
-
36
-
37
-
38
-
39
-
40
-
41
-
42
-
43
-
44
-
45
-
46
-
47
-
48
-
49
-
50
-
51
-
52
-
53
-
54
-
55
-
56
-
57
-
58
-
59
-
60
-
61
-
62
-
63
-
64
-
65
-
66
-
67
-
68
-
69
-
70
-
71
-
72
-
73
-
74
-
75
-
76
-
77
-
78
-
79
-
80
-
81
-
82
 |
 |

ANNUAL REPORT 20093
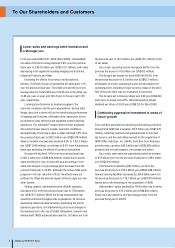
To Our Shareholders and Customers
Lower sales and earnings amid recession and
a stronger yen
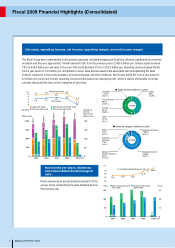
In the year ended March 31, 2009 (fiscal 2009), consolidated
net sales of the Ricoh Group declined 5.8% over the previous
fiscal year to 2,091.6 billion yen (US$21,127 million), with sales
decreasing in all segments including Imaging and Solutions,
Industrial Products and Other.
Excluding the effects of currency rate fluctuations,
however, the Ricoh Group’s consolidated net sales grew 1.1%
over the previous fiscal year; The dollar-yen and the euro-yen
average rates for fiscal 2009 were 100.55 yen to the dollar (up
13.85 yen year on year) and 143.74 yen to the euro (up 17.95
yen), respectively.
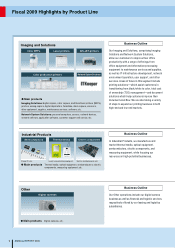
Looking at performance by business segment, the
economic recession and the yen’s appreciation, among other
things, also took a severe toll on the overall sales performance
of Imaging and Solutions, although printer sales grew, driven
by enhanced sales networks and expanded printer business
operations. The Industrial Products and the Other segments
also posted slower sales in tougher economic conditions.
Geographically, the Group’s sales in Japan declined 7.6% from
the previous fiscal year to 938.3 billion yen (US$9,478 million).
Sales in markets overseas also declined 4.2% to 1,153.3 billion
yen (US$11,649 million), an increase of 8.5% from the previous
fiscal year excluding the effects of currency fluctuations.
Gross profit declined 7.9% from the previous fiscal year
to 854.3 billion yen (US$8,629 million), mainly due to slower
sales and the yen’s rise. Gross profit as a percentage of net
sales also showed a 1.0 percentage point decrease from the
previous fiscal year to 40.8%. Although the Group made good
progress in its cost reduction efforts, the effects were not
sufficient to offset the adverse impact of the stronger yen and
other factors.
Selling, general, and administrative (SG&A) expenses
increased 4.5% from the previous fiscal year to 779.8 billion
yen (US$7,877 million). While the Group implemented cost
reduction activities throughout the organization, its focus on
developing enhanced sales networks, expanding the printer
business operations, and implementing structural changes in
the business led to the rise of SG&A. Meanwhile, research and
development (R&D) expenses decreased by 1.6 billion yen from
the previous year to 124.4 billion yen (US$1,257 million) (5.9%
of net sales).
As a result, operating income decreased 58.9% from the
previous fiscal year to 74.5 billion yen (US$753 million).
The Group’s net income for fiscal 2009 fell 93.9% from
the previous fiscal year to 6.5 billion yen (US$65.7 million),
attributable to a lower operating income and decreased non-
operating profit, including foreign currency losses in the latter
half of the year and a loss on revaluation of securities.
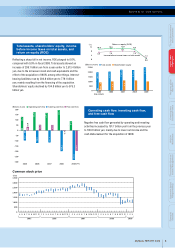
The Group’s net income per share was 9.02 yen (US$0.09)
and return on equity was 0.6%. We announced an annual
dividend per share of 33.00 yen (US$0.33) for fiscal 2009.
Continuing aggressive investment in areas of
future growth
Free cash flow generated by operating and investing activities
during fiscal 2009 was a negative 195.6 billion yen (US$1,976
million), reflecting reduced cash generated due to the lower
net income, and the cash disbursement for the acquisition of
IKON Office Solutions, Inc. (IKON). Cash flow from financing
activities was a positive 295.9 billion yen (US$2,989 million),
primarily due to bond issuance, borrowings and others.
As a result, cash and cash equivalents posted an increase
of 87.8 billion yen from the previous fiscal year to 258.4 billion
yen (US$2,610 million).
Total assets increased by 299.1 billion yen from the
previous fiscal year to 2,513.4 billion yen (US$25,388 million).
Interest-bearing liabilities increased by 394.8 billion yen from
the previous fiscal year to 779.1 billion yen (US$7,870 million),
mainly due to the financing for the acquisition of IKON.
Shareholders’ equity declined by 104.8 billion yen from the
previous fiscal year to 975.3 billion yen (US$9,852 million).
Equity ratio decreased by 10.0 percentage points from the
previous fiscal year to 38.8%.