Ricoh 2009 Annual Report Download - page 8
Download and view the complete annual report
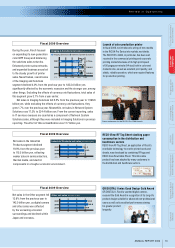
Please find page 8 of the 2009 Ricoh annual report below. You can navigate through the pages in the report by either clicking on the pages listed below, or by using the keyword search tool below to find specific information within the annual report.-
 1
1 -
 2
2 -
 3
3 -
 4
4 -
 5
5 -
 6
6 -
 7
7 -
 8
8 -
 9
9 -
 10
10 -
 11
11 -
 12
12 -
 13
13 -
 14
14 -
 15
15 -
 16
16 -
 17
17 -
 18
18 -
 19
19 -
20
-
21
-
22
-
23
-
24
-
25
-
26
-
27
-
28
-
29
-
30
-
31
-
32
-
33
-
34
-
35
-
36
-
37
-
38
-
39
-
40
-
41
-
42
-
43
-
44
-
45
-
46
-
47
-
48
-
49
-
50
-
51
-
52
-
53
-
54
-
55
-
56
-
57
-
58
-
59
-
60
-
61
-
62
-
63
-
64
-
65
-
66
-
67
-
68
-
69
-
70
-
71
-
72
-
73
-
74
-
75
-
76
-
77
-
78
-
79
-
80
-
81
-
82
 |
 |

ANNUAL REPORT 20097
(%)
2,000
1,500
1,000
500
00
50
100
150
200
7.3 7.8
5.1
4.6
4
8
6
2
0
2005
841.1 1,807.4
966.2
83.1
131.1
2006
966.2 943.0 1,909.2
148.5
97.0
2009
1,153.3 2,091.6
938.3
74.5
6.5
2008
1,203.9 2,219.9
1,016.0
181.5
8.4
5.4
4.8
2007
1,066.6 2,068.9
1,002.2
174.3
111.7
8.2
3.6
0.3
Operating margin
Net margin
C
Japan (left scale)
Overseas (left scale)
Operating income (right scale)
Net income (right scale)
A
B
C
D
(Billions of yen) (Billions of yen)
Net sales Operating
income
Net income
A
B
CD
(FY)
106.4
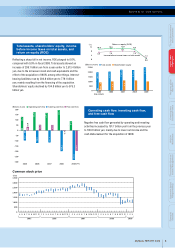
● Sales by area (billions of yen)
● Sales by category (billions of yen)
Japan
938.3
(44.9%)
Imaging Solutions
1,598.6
(76.4%)
Imaging & Solutions
1,833.0
(87.6%)
FY2009
FY2009
Other
143.0
(6.9%)
Other
127.0
(6.1%)
Overseas
1,153.3
(55.1%)
The Americas
502.8
(24.0%)
Europe
523.4
(25.0%)
Network
System Solutions
234.4
(11.2%)
Industrial
Products
115.5
(5.5%)
(%)
0
50
100
150
0
45
30
15
17.8 18.1 18.3
22.6
365.9
2006
132.33
24.0
2007
153.10
28.0
2009
9.02
33.0
2008
146.04
33.0
10
15
20
2005
112.64
20.0
Consolidated dividend payout ratio
(Yen) (Yen)
Net income per share
(left scale) Dividends per share
(right scale)
AB
(FY)
AB
Ricoh announced an annual dividend declared of 33.0
yen per share, maintaining the same dividend level as
the previous year.
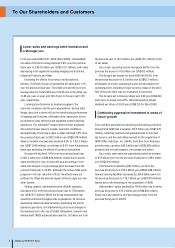
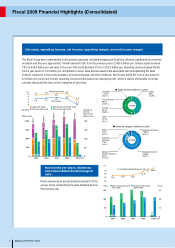
The Ricoh Group saw a sales decline in all business segments, including Imaging and Solutions, affected significantly by economic
recession and the yen’s appreciation. Overall sales fell 5.8% from the previous year to 2,091.6 billion yen. Sales in Japan declined
7.6% to 938.3 billion yen and sales in the rest of the world declined 4.2% to 1,153.3 billion yen. Operating income dropped 58.9%
from a year earlier to 74.5 billion yen, attributable to lower sales and increased costs associated with strengthening the sales
network, expansion of the printer business, structural changes, and other initiatives. Net income fell 93.9% from a year earlier to
6.5 billion yen, partly due to lower operating income and decreased non-operating profit, which is mainly attributable to foreign
currency losses and the loss on the revaluation of securities.
Net sales, operating income, net income, operating margin, and net income margin
Fiscal 2009 Financial Highlights (Consolidated)
Net income per share, dividends,
and consolidated dividend payout
ratio