Red Lobster 2010 Annual Report Download - page 69
Download and view the complete annual report
Please find page 69 of the 2010 Red Lobster annual report below. You can navigate through the pages in the report by either clicking on the pages listed below, or by using the keyword search tool below to find specific information within the annual report.-
 1
1 -
2
-
3
-
4
-
5
-
6
-
7
-
8
-
9
-
10
-
11
-
12
-
13
-
14
-
15
-
16
-
17
-
18
-
19
-
20
-
21
-
22
-
23
-
24
-
25
-
26
-
27
-
28
-
29
-
30
-
31
-
32
-
33
-
34
-
35
-
36
-
37
-
38
-
39
-
40
-
41
-
42
-
43
-
44
-
45
-
46
-
47
-
48
-
49
-
50
-
51
-
52
-
53
-
54
-
55
-
56
-
57
-
58
-
 59
59 -
 60
60 -
 61
61 -
 62
62 -
 63
63 -
 64
64 -
 65
65 -
 66
66 -
 67
67 -
 68
68 -
 69
69 -
 70
70 -
 71
71 -
 72
72
 |
 |

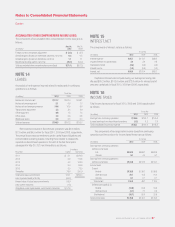
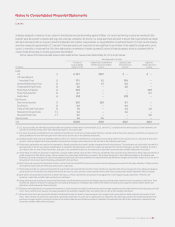
NOTE 21
QUARTERLY DATA (UNAUDITED)
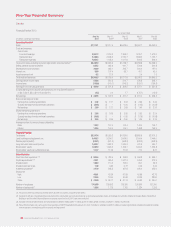
The following table summarizes unaudited quarterly data for fiscal 2010 and fiscal 2009:
Fiscal 2010 – Quarters Ended
(in millions, except per share data) Aug. 30 Nov. 29 Feb. 28(1) May 30(1) Total(2)
Sales $1,734.0 $1,641.3 $1,874.0 $1,863.8 $7,113.1
Earnings before income taxes 130.3 80.7 175.4 157.2 543.6
Earnings from continuing operations 95.0 61.2 134.8 116.0 407.0
Losses from discontinued operations, net of tax (0.7) (0.9) (0.5) (0.4) (2.5)
Net earnings 94.3 60.3 134.3 115.6 404.5
Basic net earnings per share:
Earnings from continuing operations 0.68 0.44 0.97 0.83 2.92
Losses from discontinued operations – (0.01) (0.01) (0.01) (0.02)
Net earnings 0.68 0.43 0.96 0.82 2.90
Diluted net earnings per share:
Earnings from continuing operations 0.67 0.43 0.95 0.81 2.86
Losses from discontinued operations – – (0.01) (0.01) (0.02)
Net earnings 0.67 0.43 0.94 0.80 2.84
Dividends paid per share 0.25 0.25 0.25 0.25 1.00
Stock price:
High 38.10 37.31 41.34 49.01 49.01
Low 30.79 29.94 30.95 39.79 29.94
Fiscal2009–QuartersEnded
(in millions, except per share data) Aug. 24 Nov. 23 Feb. 22 May 31(3) Total(2)
Sales $1,774.2 $1,668.9 $1,798.9 $1,975.5 $7,217.5
Earnings before income taxes 114.4 82.5 148.5 167.1 512.5
Earnings from continuing operations 82.4 58.5 108.1 122.8 371.8
(Losses) earnings from discontinued operations, net of tax (0.3) 1.1 (0.6) 0.2 0.4
Net earnings 82.1 59.6 107.5 123.0 372.2
Basic net earnings per share:
Earnings from continuing operations 0.59 0.43 0.79 0.89 2.71
(Losses)earningsfromdiscontinuedoperations – 0.01 – – –
Net earnings 0.59 0.44 0.79 0.89 2.71
Diluted net earnings per share:
Earnings from continuing operations 0.58 0.42 0.78 0.87 2.65
(Losses)earningsfromdiscontinuedoperations – 0.01 – – –
Net earnings 0.58 0.43 0.78 0.87 2.65
Dividends paid per share 0.20 0.20 0.20 0.20 0.80
Stock price:
High 37.01 32.26 29.54 40.26 40.26
Low 29.04 13.54 15.66 24.32 13.54
(1) During the fourth quarter of fiscal 2010, we recognized a $12.7 million pre-tax reduction in sales associated with a correction to our third quarter estimate of gift card breakage, which
reduced earnings from continuing operations and net earnings by $7.8 million, or approximately $0.05 reduction to diluted net earnings per share from continuing operations.
(2) The year ended May 31, 2009 consisted of 53 weeks, while fiscal 2010 consisted of 52 weeks.
(3) The quarter ended May 31, 2009 consisted of 14 weeks, while all other quarters consisted of 13 weeks.
DARDEN RESTAURANTS, INC. | 2010 ANNUAL REPORT 67
Notes to Consolidated Financial Statements
Darden