Red Lobster 2010 Annual Report Download - page 27
Download and view the complete annual report
Please find page 27 of the 2010 Red Lobster annual report below. You can navigate through the pages in the report by either clicking on the pages listed below, or by using the keyword search tool below to find specific information within the annual report.-
 1
1 -
2
-
3
-
4
-
5
-
6
-
7
-
8
-
9
-
10
-
11
-
12
-
13
-
14
-
15
-
16
-
 17
17 -
 18
18 -
 19
19 -
 20
20 -
 21
21 -
 22
22 -
 23
23 -
 24
24 -
 25
25 -
 26
26 -
 27
27 -
 28
28 -
 29
29 -
 30
30 -
 31
31 -
 32
32 -
 33
33 -
 34
34 -
 35
35 -
 36
36 -
 37
37 -
38
-
39
-
40
-
41
-
42
-
43
-
44
-
45
-
46
-
47
-
48
-
49
-
50
-
51
-
52
-
53
-
54
-
55
-
56
-
57
-
58
-
59
-
60
-
61
-
62
-
63
-
64
-
65
-
66
-
67
-
68
-
69
-
70
-
71
-
72
 |
 |

DARDEN RESTAURANTS, INC. | 2010 ANNUAL REPORT 25
Notes to Consolidated Financial Statements
Darden Restaurants
DARDEN RESTAURANTS, INC. | 2010 ANNUAL REPORT 25
Management’s Discussion and Analysis
of Financial Condition and Results of Operations
Darden
integration costs and purchase accounting adjustments related to the RARE
acquisition, partially offset by a decrease in credit card expense.
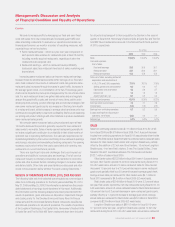
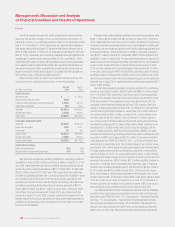
Selling, general and administrative expenses increased $18.9 million,
or 2.8 percent, from $665.6 million in fiscal 2009 to $684.5 million in fiscal
2010. Selling, general and administrative expenses increased $23.9 million,
or 3.7 percent, from $641.7 million in fiscal 2008 to $665.6 million in fiscal
2009. As a percent of sales, selling, general and administrative expenses
increased from fiscal 2009 to fiscal 2010 primarily as a result of unfavorable
market-driven changes in fair value related to our non-qualified deferred
compensation plans in fiscal 2010 compared to fiscal 2009, as well as an
increase in advertising expenses, performance incentive compensation and
the impact of sales deleveraging. As a percent of sales, selling, general and
administrative expenses decreased from fiscal 2008 to fiscal 2009 primarily
as a result of a reduction in transaction and integration-related costs and
purchase accounting adjustments related to the RARE acquisition, market-
driven changes in fair value related to our non-qualified deferred compensa-
tion plans, sales growth leveraging and lower corporate level expenses as a
result of savings initiatives, partially offset by an increase in advertising expenses.
Depreciation and amortization expense increased $17.8 million, or
6.3 percent, from $283.1 million in fiscal 2009 to $300.9 million in fiscal
2010. Depreciation and amortization expense increased $37.4 million, or
15.2 percent, from $245.7 million in fiscal 2008 to $283.1 million in fiscal
2009. As a percent of sales, depreciation and amortization expense increased
in fiscal 2010 as a result of new restaurant openings, the incremental
depreciation associated with the new restaurant support center facility and sales
deleveraging. As a percent of sales, depreciation and amortization expense
increased in fiscal 2009 as a result of new restaurant openings, which was
partially offset by increased sales growth leveraging.
Net interest expense decreased $13.5 million, or 12.6 percent, from
$107.4 million in fiscal 2009 to $93.9 million in fiscal 2010. Net interest
expense increased $21.7 million, or 25.3 percent, from $85.7 million in fiscal
2008 to $107.4 million in fiscal 2009. As a percent of sales, net interest expense
decreased in fiscal 2010 compared to fiscal 2009 primarily as a result of lower
average debt balances associated with the repayment of all our short-term
debt and the release of interest reserves associated with the favorable
resolution in the current year of prior year tax matters. As a percent of sales,
net interest expense increased in fiscal 2009 compared to fiscal 2008 due
mainly to an increase in average long-term debt balances associated with
the acquisition of RARE, partially offset by a decrease in interest rates on our
short-term debt.
During fiscal 2010, 2009 and 2008, we recognized asset impairment
charges of $6.2 million, $12.0 million and $0.0 million, respectively, related
primarily to the planned closure, disposal, relocation or rebuilding of certain
restaurants and write downs of assets held for disposition reported in
continuing operations.
INCOME TAXES
The effective income tax rates for fiscal 2010, 2009 and 2008 continuing
operations were 25.1 percent, 27.5 percent and 28.2 percent, respectively.
The decrease in our effective rate for fiscal 2010 is due primarily to the impact
of market-driven changes in the value of our trust-owned life insurance that
are excluded for tax purposes and favorable resolution of prior year tax matters
expensed in prior years. The decrease in our effective rate for fiscal 2009
compared to fiscal 2008 is due primarily to an increase in FICA tax credits
for employee reported tips.
NET EARNINGS AND NET EARNINGS PER SHARE FROM
CONTINUING OPERATIONS
Net earnings from continuing operations for fiscal 2010 were $407.0 million
($2.86 per diluted share) compared with net earnings from continuing
operations for fiscal 2009 of $371.8 million ($2.65 per diluted share) and
net earnings from continuing operations for fiscal 2008 of $369.5 million
($2.55 per diluted share).
Net earnings from continuing operations for fiscal 2010 increased
9.5 percent and diluted net earnings per share from continuing operations
increased 7.9 percent compared with fiscal 2009. The increases in net
earnings and diluted net earnings per share from continuing operations were
primarily due to decreases in food and beverage costs, restaurant expenses
and interest expenses as a percent of sales, which were only partially offset
by increases in restaurant labor, selling, general and administrative expenses
and depreciation and amortization expenses as a percent of sales. Diluted net
earnings per share growth for fiscal 2010 was reduced by approximately nine
cents as a result of adjustments to our gift card redemption rate assumptions
based on current consumer redemption behavior. The additional operating
week in fiscal 2009 contributed approximately six cents of diluted net earnings
per share in fiscal 2009.
Net earnings from continuing operations for fiscal 2009 were
$371.8 million ($2.65 per diluted share) compared with net earnings from
continuing operations for fiscal 2008 of $369.5 million ($2.55 per diluted
share). Net earnings from continuing operations for fiscal 2009 increased
0.6 percent and diluted net earnings per share from continuing operations
increased 3.9 percent compared with fiscal 2008. Integration costs and
purchase accounting adjustments related to the acquisition of RARE reduced
diluted net earnings per share from continuing operations by approximately
10 cents and 19 cents in fiscal 2009 and 2008, respectively. The additional
operating week in fiscal 2009 contributed approximately six cents of diluted
net earnings per share in fiscal 2009. Diluted net earnings per share from
continuing operations also benefited from the cumulative impact of our share
repurchase program.
(LOSSES) EARNINGS FROM DISCONTINUED OPERATIONS
On an after-tax basis, losses from discontinued operations for fiscal 2010 were
$2.5 million ($0.02 per diluted share) compared with earnings from discontinued
operations for fiscal 2009 of $0.4 million ($0.00 per diluted share) and earnings
from discontinued operations for fiscal 2008 of $7.7 million ($0.05 per diluted
share). During fiscal 2008, we recorded an $18.0 million gain on disposal
related to the sale of the operating Smokey Bones restaurants.
SEASONALITY
Our sales volumes fluctuate seasonally. During fiscal 2010 and 2008,
our average sales per restaurant were highest in the winter and spring,
followed by the summer, and lowest in the fall. During 2009, our average
sales per restaurant were highest in the summer and spring, followed by
the winter, and lowest in the fall. Holidays, changes in the economy, severe
weather and similar conditions may impact sales volumes seasonally in
some operating regions. Because of the seasonality of our business, results
for any quarter are not necessarily indicative of the results that may be
achieved for the full fiscal year.