Red Lobster 2010 Annual Report Download - page 34
Download and view the complete annual report
Please find page 34 of the 2010 Red Lobster annual report below. You can navigate through the pages in the report by either clicking on the pages listed below, or by using the keyword search tool below to find specific information within the annual report.-
 1
1 -
2
-
3
-
4
-
5
-
6
-
7
-
8
-
9
-
10
-
11
-
12
-
13
-
14
-
15
-
16
-
17
-
18
-
19
-
20
-
21
-
22
-
23
-
 24
24 -
 25
25 -
 26
26 -
 27
27 -
 28
28 -
 29
29 -
 30
30 -
 31
31 -
 32
32 -
 33
33 -
 34
34 -
 35
35 -
 36
36 -
 37
37 -
 38
38 -
 39
39 -
 40
40 -
 41
41 -
 42
42 -
 43
43 -
 44
44 -
45
-
46
-
47
-
48
-
49
-
50
-
51
-
52
-
53
-
54
-
55
-
56
-
57
-
58
-
59
-
60
-
61
-
62
-
63
-
64
-
65
-
66
-
67
-
68
-
69
-
70
-
71
-
72
 |
 |

32 DARDEN RESTAURANTS, INC. | 2010 ANNUAL REPORT
Notes to Consolidated Financial Statements
Darden Restaurants
32 DARDEN RESTAURANTS, INC. | 2010 ANNUAL REPORT
Management’s Discussion and Analysis
of Financial Condition and Results of Operations
Darden
Our fixed-charge coverage ratio, which measures the number of times
each year that we earn enough to cover our fixed charges, amounted to 4.7
times and 4.2 times, on a continuing operations basis, for the fiscal years ended
May 30, 2010 and May 31, 2009, respectively. Our adjusted debt to adjusted
total capital ratio (which includes 6.25 times the total annual minimum rent of
$120.8 million and $114.1 million for the fiscal years ended May 30, 2010 and
May 31, 2009, respectively, as components of adjusted debt and adjusted total
capital) was 57 percent and 62 percent at May 30, 2010 and May 31, 2009,
respectively. We include the lease-debt equivalent and contractual guarantees
in our adjusted debt to adjusted total capital ratio reported to shareholders, as
we believe its inclusion better represents the optimal capital structure that we
target from period to period and because it is consistent with the calculation of
the covenant under our Revolving Credit Agreement.
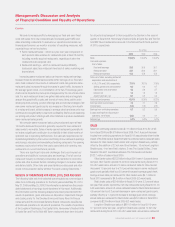
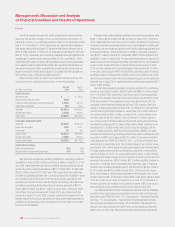
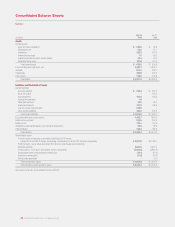
Based on these ratios, we believe our financial condition is strong. The
composition of our capital structure is shown in the following table.
May 30, May 31,
(In millions, except ratios)
2010 2009
Capital Structure
Short-term debt $ – $ 150.0
Current portion long-term debt 225.0–
Long-term debt, excluding unamortized discounts 1,413.6 1,637.9
Capital lease obligations 58.9 60.0
Total debt $1,697.5 $1,847.9
Stockholders’ equity 1,894.0 1,606.0
Total capital $3,591.5 $3,453.9
Calculation of Adjusted Capital
Total debt $1,697.5 $1,847.9
Lease-debt equivalent 755.0 713.1
Guarantees 9.0 8.8
Adjusted debt $2,461.5 $2,569.8
Stockholders’ equity 1,894.0 1,606.0
Adjusted total capital $4,355.5 $4,175.8
Capital Structure Ratios
Debt to total capital ratio 47% 54%
Adjusted debt to adjusted total capital ratio 57% 62%
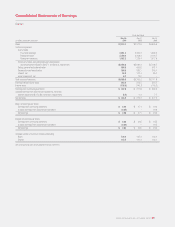
Net cash flows provided by operating activities from continuing operations
were $903.4 million, $783.5 million and $766.8 million in fiscal 2010, 2009
and 2008, respectively. Net cash flows provided by operating activities include
net earnings from continuing operations of $407.0 million, $371.8 million and
$369.5 million in fiscal 2010, 2009 and 2008, respectively. Net cash flows
provided by operating activities from continuing operations increased in fiscal
2010 primarily due to the impact of the timing of inventory purchases and
overall product demand, lower costs and higher net earnings. Net cash flows
provided by operating activities also reflect income tax payments of $94.8
mil lion, $64.4 million and $119.7 million in fiscal 2010, 2009 and 2008,
respectively. The lower tax payments in fiscal 2009, as compared with tax
payments in fiscal 2010 and 2008, primarily relates to the recognition of tax
benefits related to the timing of deductions for fixed asset related expenditures,
in addition to the application of the overpayment of income taxes in prior years
to fiscal 2009 tax liabilities.
Net cash flows used in investing activities from continuing operations were
$428.7 million, $562.4 million and $1.62 billion in fiscal 2010, 2009 and
2008, respectively. Net cash flows used in investing activities from continuing
operations included capital expenditures incurred principally for building new
restaurants, our new restaurant support center facility, replacing equipment and
technology initiatives. Capital expenditures related to continuing operations
were $432.1 million in fiscal 2010, compared to $535.3 million in fiscal 2009
and $429.2 million in fiscal 2008. The decreased expenditures in fiscal 2010
resulted primarily from decreased spending associated with our new restaurant
support center facility which was completed in the second quarter of fiscal
2010, and the replacement of restaurant assets. Excluding the $1.20 billion
in net cash used to acquire RARE in fiscal 2008, cash flows used in investing
activities increased in fiscal 2009, primarily due to an increase in new restau-
rant activity and construction of our new restaurant support center facility. We
estimate that our fiscal 2011 capital expenditures will be approximately $475
million to $525 million.
Net cash flows (used in) provided by financing activities from continuing
operations were ($290.0) million, ($204.8) million and $805.5 million in fiscal
2010, 2009 and 2008, respectively. Cash flows used in financing activities
for fiscal 2010 exceeded the cash flows used in financing activities for fiscal
2009 due primarily to the repayment of short-term debt in fiscal 2010 as
compared to short-term borrowings during fiscal 2009, partially offset by a
reduction in shares repurchased in fiscal 2010. For fiscal 2010, net cash flows
used in financing activities included our repurchase of 2.0 million shares of
our common stock for $85.1 million, compared to 5.1 million shares of our
common stock for $144.9 million in fiscal 2009 and 5.0 million shares of
our common stock for $159.4 million in fiscal 2008. During fiscal 2008 we
completed the offering of $1.15 billion of New Senior Notes, resulting in net
proceeds of $1.13 billion, which were used to repay borrowings under an
interim credit agreement, which funded the acquisition of RARE. Proceeds
received from the Revolving Credit Agreement were used to partially fund the
acquisition of RARE and to repay the $125.0 million 2.5 percent convertible
notes assumed from RARE. As of May 30, 2010, our Board of Directors had
authorized us to repurchase up to 162.4 million shares of our common stock
and a total of 154.1 million shares had been repurchased under the authorization.
The repurchased common stock is reflected as a reduction of stockholders’
equity. As of May 30, 2010, our unused authorization was 8.3 million shares.
We received proceeds primarily from the issuance of common stock upon the
exercise of stock options of $66.3 million, $57.5 million and $66.8 million in
fiscal 2010, 2009 and 2008, respectively. Net cash flows used in financing
activities also included dividends paid to stockholders of $140.0 million,
$110.2 million and $100.9 million in fiscal 2010, 2009 and 2008, respec-
tively. The increase in dividend payments reflects the increase in our annual
dividend rate from $0.72 per share in fiscal 2008, to $0.80 per share in fiscal
2009 and to $1.00 per share in fiscal 2010. In June 2010, the Board of
Directors approved an increase in the quarterly dividend to $0.32 per share,
which indicates an annual dividend of $1.28 per share in fiscal 2011.
Our defined benefit and other postretirement benefit costs and liabilities
are determined using various actuarial assumptions and methodologies
prescribedunderFASBASCTopic715,Compensation–RetirementBenefits
andTopic712,Compensation–NonretirementPostemploymentBenefits.
We use certain assumptions including, but not limited to, the selection of a
discount rate, expected long-term rate of return on plan assets and expected
health care cost trend rates. We set the discount rate assumption annually for