Red Lobster 2010 Annual Report Download - page 62
Download and view the complete annual report
Please find page 62 of the 2010 Red Lobster annual report below. You can navigate through the pages in the report by either clicking on the pages listed below, or by using the keyword search tool below to find specific information within the annual report.-
 1
1 -
2
-
3
-
4
-
5
-
6
-
7
-
8
-
9
-
10
-
11
-
12
-
13
-
14
-
15
-
16
-
17
-
18
-
19
-
20
-
21
-
22
-
23
-
24
-
25
-
26
-
27
-
28
-
29
-
30
-
31
-
32
-
33
-
34
-
35
-
36
-
37
-
38
-
39
-
40
-
41
-
42
-
43
-
44
-
45
-
46
-
47
-
48
-
49
-
50
-
51
-
 52
52 -
 53
53 -
 54
54 -
 55
55 -
 56
56 -
 57
57 -
 58
58 -
 59
59 -
 60
60 -
 61
61 -
 62
62 -
 63
63 -
 64
64 -
 65
65 -
 66
66 -
 67
67 -
 68
68 -
 69
69 -
 70
70 -
 71
71 -
 72
72
 |
 |

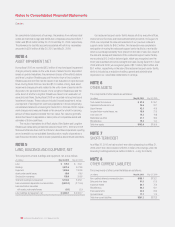
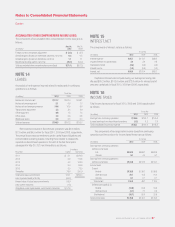
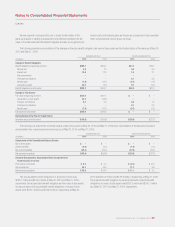
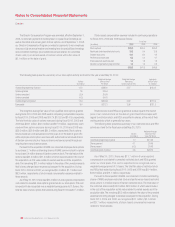
The following table presents the weighted-average assumptions used to determine benefit obligations and net expense:
Defined Benefit Plans Postretirement Benefit Plan
2010 2009 2010 2009
Weighted-average assumptions used to determine
benefit obligations at May 30 and May 31 (1)
Discount rate 5.89% 7.00% 5.98% 7.10%
Rate of future compensation increases 3.75% 3.75% N/A N/A
Weighted-average assumptions used to determine net expense
for fiscal years ended May 30 and May 31 (2)
Discount rate 7.00% 6.50% 7.09% 6.50%
Expected long-term rate of return on plan assets 9.00% 9.00% N/A N/A
Rate of future compensation increases 3.75% 3.75% N/A N/A
(1) Determined as of the end of fiscal year.
(2) Determined as of the beginning of fiscal year.
60 DARDEN RESTAURANTS, INC. | 2010 ANNUAL REPORT
Notes to Consolidated Financial Statements
Darden
We set the discount rate assumption annually for each of the plans at
their valuation dates to reflect the yield of high-quality fixed-income debt
instruments, with lives that approximate the maturity of the plan benefits. The
expected long-term rate of return on plan assets and health care cost trend
rates are based upon several factors, including our historical assumptions
compared with actual results, an analysis of current market conditions, asset
fund allocations and the views of leading financial advisers and economists.
For fiscal 2010, 2009 and 2008, we have used an expected long-term
rate of return on plan assets for our defined benefit plan of 9.0 percent. In
developing our expected rate of return assumption, we have evaluated the
actual historical performance and long-term return projections of the plan
assets, which give consideration to the asset mix and the anticipated timing
of the pension plan outflows. We employ a total return investment approach
whereby a mix of equity and fixed income investments are used to maximize
the long-term return of plan assets for what we consider a prudent level of
risk. Our historical 10-year, 15-year and 20-year rates of return on plan
assets, calculated using the geometric method average of returns, are
approximately 5.8 percent, 8.8 percent and 9.4 percent, respectively, as
of May 30, 2010.
The discount rate and expected return on plan assets assumptions
have a significant effect on amounts reported for defined benefit pension
plans. A quarter percentage point change in the defined benefit plans’
discount rate and the expected long-term rate of return on plan assets would
increase or decrease earnings before income taxes by $1.4 million and
$0.5 million, respectively.
The assumed health care cost trend rate increase in the per-capita
charges for postretirement benefits was 8.0 percent for fiscal 2011. The rate
gradually decreases to 5.0 percent through fiscal 2021 and remains at that
level thereafter.
The assumed health care cost trend rate has a significant effect on
amounts reported for retiree health care plans. A one percentage point
increase or decrease in the assumed health care cost trend rate would affect
the service and interest cost components of net periodic postretirement
benefit cost by $0.5 million and $0.4 million, respectively, and would increase
or decrease the accumulated postretirement benefit obligation by $8.3 million
and $6.5 million, respectively.
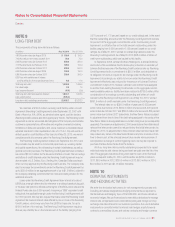
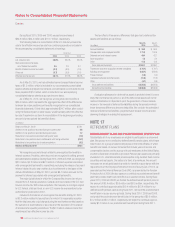
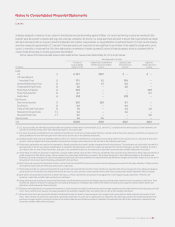
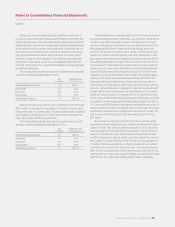
Components of net periodic benefit cost included in continuing operations are as follows:
Defined Benefit Plans Postretirement Benefit Plan
(in millions) 2010 2009 2008 2010 2009 2008
Service cost $ 4.9 $ 6.0 $ 6.1 $0.6 $0.7 $ 0.7
Interest cost 10.0 9.9 9.7 1.9 1.7 1.2
Expected return on plan assets (16.4) (16.3) (14.8) – – –
Amortization of unrecognized prior service cost 0.1 0.2 0.1 – – (0.1)
Recognized net actuarial loss 0.3 0.4 4.3 0.6 0.6 0.3
Net pension and postretirement (benefit) cost $(1.1) $ 0.2 $ 5.4 $3.1 $3.0 $2.1
The amortization of the net actuarial loss component of our fiscal 2011 net periodic benefit cost for the defined benefit plans and postretirement benefit plan
is expected to be approximately $4.5 million and $1.3 million, respectively.
Our Benefit Plans Committee sets the investment policy for the Defined Benefit Plans and oversees the investment allocation, which includes setting
long-term strategic targets. Our overall investment strategy is to achieve appropriate diversification through a mix of equity investments, which may include
U.S., international, and private equities, as well as long duration bonds and real asset investments. Our target asset fund allocation is 35 percent U.S. equities,
30 percent high-quality, long-duration fixed-income securities, 15 percent international equities, 10 percent real assets and 10 percent private equities. The
investment policy establishes a re-balancing band around the established targets within which the asset class weight is allowed to vary. Equity securities, inter-
national equities and fixed-income securities include investments in various industry sectors. Investments in real assets and private equity funds follow different