Red Lobster 2010 Annual Report Download - page 4
Download and view the complete annual report
Please find page 4 of the 2010 Red Lobster annual report below. You can navigate through the pages in the report by either clicking on the pages listed below, or by using the keyword search tool below to find specific information within the annual report.-
 1
1 -
 2
2 -
 3
3 -
 4
4 -
 5
5 -
 6
6 -
 7
7 -
 8
8 -
 9
9 -
 10
10 -
 11
11 -
 12
12 -
 13
13 -
 14
14 -
 15
15 -
16
-
17
-
18
-
19
-
20
-
21
-
22
-
23
-
24
-
25
-
26
-
27
-
28
-
29
-
30
-
31
-
32
-
33
-
34
-
35
-
36
-
37
-
38
-
39
-
40
-
41
-
42
-
43
-
44
-
45
-
46
-
47
-
48
-
49
-
50
-
51
-
52
-
53
-
54
-
55
-
56
-
57
-
58
-
59
-
60
-
61
-
62
-
63
-
64
-
65
-
66
-
67
-
68
-
69
-
70
-
71
-
72
 |
 |

LETTER TO SHAREHOLDERS
Fiscal 2010 Financial Highlights
Although absolute results from continuing operations for
fiscal 2010 were below our long-range targets due to
the challenging economic and industry environment, our
performance was nevertheless competitively superior.
• Salesfromcontinuingoperationswere$7.11billion,a
1.4percentdecreasefromscalyear2009’s$7.22billion.
Excluding an additional fiscal week in fiscal 2009, which
contributedapproximately$124millioninsales,totalsales
increased approximately 0.3 percent in fiscal 2010.
• Totalsalesresultsfromcontinuingoperationsreecta
combined U.S. same-restaurant sales decline for Olive
Garden, Red Lobster and LongHorn Steakhouse of
2.6 percent, which was 2.3 percentage points better than
the 4.9 percent decline in the Knapp-Track™ benchmark of
U.S. same-restaurant sales, offset partially by incremental
sales from the net addition of 51 restaurants.
• Netearningsfromcontinuingoperationsforscal2010were
$407.0million,a9.5percentincreasefromnetearnings
fromcontinuingoperationsof$371.8millioninscal2009.
Diluted net earnings per share from continuing operations
forscal2010were$2.86,a7.9percentincreasefrom
dilutednetearningspershareof$2.65inscal2009.
• Inscal2010,netlossesfromdiscontinuedoperations
were$2.5million,anddilutednetlossespersharefrom
discontinuedoperationswere$0.02,relatedprimarilyto
the carrying costs and losses on the remaining properties
held for disposition associated with Smokey Bones and
BahamaBreezeclosingsfromscal2007andscal2008.
Including losses from discontinued operations, net earnings
were$404.5millioninscal2010,8.7percentabovenet
earningsof$372.2millioninscal2009.Includinglosses
from discontinued operations, diluted net earnings per
sharewere$2.84inscal2010comparedto$2.65in
fiscal 2009.
• OliveGarden’stotalsaleswerearecord$3.32billion,up
1.0 percent from fiscal 2009, despite one less fiscal week.
Thisreectedaverageannualsalesperrestaurantof
$4.7million,theadditionof32netnewrestaurantsanda
U.S. same-restaurant sales decline of 1.0 percent (52 weeks
vs. 52 weeks), which was 3.9 percentage points favorable
to the Knapp-Track competitive benchmark.
• RedLobster’stotalsaleswere$2.49billion,adecreaseof
5.3 percent from fiscal 2009, which included the extra fiscal
week.Averageannualsalesperrestaurantwere$3.6million
and U.S. same-restaurant sales for fiscal 2010 fell 4.9 percent
(52 weeks vs. 52 weeks), which was equal to the decline
for the Knapp-Track competitive benchmark.
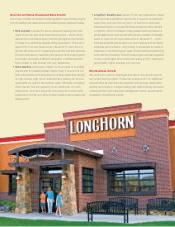
• LongHornSteakhouse’stotalsaleswere$882million,a
decreaseof0.7percentfromscal2009,whichincluded
theextrascalweek.Thisreectedaverageannualsales
perrestaurantof$2.7million,theadditionof10netnew
restaurants and a U.S. same-restaurant sales decline
of 1.9 percent (52 weeks vs. 52 weeks), which was
3.0 percentage points favorable to the Knapp-Track
competitive benchmark.
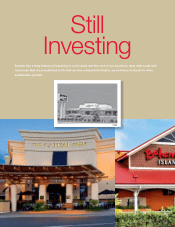
• TheCapitalGrille’stotalsaleswerearecord$242million,a
3.2 percent increase from fiscal 2009, despite one less fiscal
week.Averageannualsalesperrestaurantwere$6.2million,
three new restaurants were added and same-restaurant
salesdeclined7.8percent(52weeksvs.52weeks).
• BahamaBreeze’stotalsaleswere$130million,down
1.0 percent from fiscal 2009, driven by one less fiscal week
and a same-restaurant sales decline of 2.9 percent (52 weeks
vs. 52 weeks), which was offset partially by the addition of
one new restaurant. Average annual sales per restaurant
were$5.4million.
2 DARDEN RESTAURANTS, INC. | 2010 ANNUAL REPORT
To Our Shareholders, Employees and Guests: The end of fiscal 2010 marked the 15-year anniversary
of Darden’s June 1995 spin-off from General Mills as an independent, publicly traded company. Fiscal 2010
was also another year, like the preceding two, in which economic and consumer conditions were challenging.
During difficult times, it is tempting to hunker down and take comfort in focusing narrowly on the day
to day. Darden’s rich history consistently reminds us, however, that long-term perspective and planning
is critical. As we look back over our past 15 years, we understand that long-term success depends on
finding the right balance between continuity and change. We would like to share some highlights from
fiscal 2010, then review, as we begin our next 15-year journey, where you can expect continuity and where
we believe there will be a need for change.