Pfizer 2006 Annual Report Download - page 32
Download and view the complete annual report
Please find page 32 of the 2006 Pfizer annual report below. You can navigate through the pages in the report by either clicking on the pages listed below, or by using the keyword search tool below to find specific information within the annual report.-
 1
1 -
2
-
3
-
4
-
5
-
6
-
7
-
8
-
9
-
10
-
11
-
12
-
13
-
14
-
15
-
16
-
17
-
18
-
19
-
20
-
21
-
 22
22 -
 23
23 -
 24
24 -
 25
25 -
 26
26 -
 27
27 -
 28
28 -
 29
29 -
 30
30 -
 31
31 -
 32
32 -
 33
33 -
 34
34 -
 35
35 -
 36
36 -
 37
37 -
 38
38 -
 39
39 -
 40
40 -
 41
41 -
 42
42 -
43
-
44
-
45
-
46
-
47
-
48
-
49
-
50
-
51
-
52
-
53
-
54
-
55
-
56
-
57
-
58
-
59
-
60
-
61
-
62
-
63
-
64
-
65
-
66
-
67
-
68
-
69
-
70
-
71
-
72
-
73
-
74
-
75
-
76
-
77
-
78
-
79
-
80
-
81
-
82
-
83
-
84
 |
 |

30 2006 Financial Report
Financial Review
Pfizer Inc and Subsidiary Companies
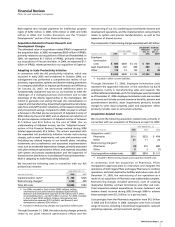
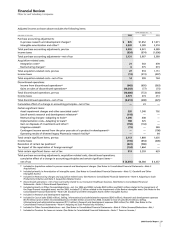
Summary of Cash Flows
YEAR ENDED DEC. 31,
_________________________________________________
(MILLIONS OF DOLLARS) 2006 2005 2004
Cash provided by/(used in):
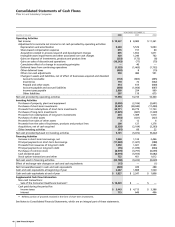
Operating activities $ 17,594 $14,733 $16,340
Investing activities 5,101 (5,072) (9,422)
Financing activities (23,100) (9,222) (6,629)
Effect of exchange-rate
changes on cash and cash
equivalents (15) — (1)
Net increase/(decrease) in cash
and cash equivalents $ (420) $ 439 $ 288
Operating Activities
Our net cash provided by continuing operating activities was
$17.6 billion in 2006, as compared to $14.7 billion in 2005. The
increase in net cash provided by operating activities was primarily
attributable to:
•
the payment of $1.7 billion in taxes in 2005 associated with the
repatriation of approximately $37 billion of foreign earnings
under the Jobs Act in 2005; and
•
the timing of other receipts and payments in the ordinary
course of business.
Our net cash provided by continuing operating activities was
$14.7 billion in 2005, as compared to $16.3 billion in 2004. The
decrease in net cash provided by operating activities was primarily
attributable to:
•
the payment of $1.7 billion in taxes associated with the
repatriation of approximately $37 billion of foreign earnings
under the Jobs Act; and
•
the timing of other receipts and payments in the ordinary
course of business.
The estimated net cash flows provided by operating activities
associated with discontinued operations were not significant.
In 2006, the cash flow line item called Income taxes payable of $2.9
billion primarily reflects the taxes provided on the gain on the sale
of our Consumer Healthcare business that have not yet been paid.
Investing Activities
Our net cash provided by investing activities was $5.1 billion in
2006, as compared to net cash used by investing activities of $5.1
billion in 2005. The increase in net cash provided by investing
activities was primarily attributable to:
•
higher net redemptions of short-term investments in 2006 (an
increased source of cash of $12.4 billion), primarily used to pay
down short-term borrowings,
partially offset by:
•
an increase in net purchases of long-term investments (an
increased use of cash of $2.3 billion); and
•
the acquisition of PowderMed Ltd., Rinat and sanofi-aventis’
rights to Exubera in 2006 compared to the acquisition of
Vicuron and Idun in 2005 (an increased use of cash of $216
million).
Our net cash used by investing activities was $5.1 billion in 2005,
as compared to $9.4 billion in 2004. The decrease in net cash used
by investing activities was primarily attributable to:
•
a decrease in net purchases of investments (a decreased use of
$4.9 billion), due primarily to higher redemptions of investments
in 2005 to provide funds for the repatriation of foreign earnings
in accordance with the Jobs Act; and
•
lower purchases of plant, property and equipment (a decreased
use of $495 million),
partially offset by:
•
lower proceeds from the sales of businesses, product lines and
other products (a decreased source of cash of $1.1 billion).
The estimated net cash flows used in investing activities associated
with discontinued operations were not significant.
Financing Activities
Our net cash used in financing activities increased to $23.1 billion
in 2006, as compared to $9.2 billion in 2005. The increase in net
cash used in financing activities was primarily attributable to:
•
net repayments of $9.9 billion on total borrowings in 2006, as
compared to $321 million in 2005;
•
an increase in cash dividends paid of $1.4 billion in 2006, as
compared to 2005, primarily due to an increase in the dividend
rate; and
•
higher purchases of common stock in 2006 of $7.0 billion, as
compared to $3.8 billion in 2005,
partially offset by:
•
higher proceeds of $243 million from the exercise of employee
stock options.
Our net cash used in financing activities increased to $9.2 billion
in 2005, as compared to $6.6 billion in 2004. The increase in net
cash used in financing activities was primarily attributable to:
•
net repayments of $321 million on total borrowings in 2005, as
compared to total net borrowings of $4.1 billion in 2004, as
funds from the repatriation of foreign earnings in 2005 were
used to finance domestic activities, thereby reducing our
reliance on short-term borrowings;
•
an increase in cash dividends paid of $473 million, as compared
to 2004, primarily due to an increase in the dividend rate; and
•
a decrease of $610 million in the proceeds from the exercise of
employee stock options,
partially offset by:
•
lower purchases of common stock in 2005 of $3.8 billion, as
compared to $6.7 billion in 2004.
The estimated net cash flows used in financing activities associated
with discontinued operations were not significant.